observability-mcp
เซิร์ฟเวอร์ MCP หนึ่งตัวที่เชื่อมต่อกับแบ็กเอนด์การสังเกตการณ์ใดๆ ผ่านตัวเชื่อมต่อแบบเสียบได้ ปรับข้อมูลให้เป็นมาตรฐาน เพิ่มการวิเคราะห์อัจฉริยะ และมีเว็บ UI สำหรับการกำหนดค่า
เอกสาร
observability-mcp
The unified observability gateway for AI agents.
One MCP server that connects to any observability backend through pluggable connectors, normalizes the data, adds robust anomaly analysis, and provides a web UI for configuration.
One MCP endpoint, every backend — so an agent triaging an incident asks one normalized question instead of juggling N vendor servers and their query languages.
0/10 → 10/10: the same 8B local model goes from hallucinating blast-radius answers to exactly correct ones once it gets this gateway's topology tools — measured, not asserted.
npx @thotischner/observability-mcp                                    # start (UI on :3000)
claude mcp add observability --transport http http://localhost:3000/mcp   # wire into Claude
Twelve read-only tools (readOnlyHint: true on every one) · server-side filter/aggregate
so agents get numbers, not haystacks · For-Agents guide
![]()


![]()

All badges — CI, Helm, supply chain (cosign / SBOM / SLSA / provenance)
![]()
📖 Full documentation site: https://thotischner.github.io/observability-mcp/
🔌 Open in MCP Inspector — one-line interactive explorer:
npx --yes @modelcontextprotocol/inspector \
  --config <(npx --yes @thotischner/observability-mcp inspector-config)
Why it matters — measured, not asserted
On a real Kubernetes-platform-team question ("which other pods share a node with
payment-service so we know what else falls over if that node goes down?"), the same
local model produces wildly different answers depending on the tools you hand it:
| Tools available to the agent (llama3.1:8b, n=10) | Cross-namespace blast-radius accuracy |
|---|---|
| Generic metric + log + service tools | 0 / 10 — hallucinates the wrong entity type (prometheus, loki, kubernetes) |
Same model + get_topology + get_blast_radius | 10 / 10 — exact correct co-tenant list, every iteration |
Raw JSON for both arms, plus three more scenarios (single-service RCA, in-namespace
blast radius, scenarios where topology does not help), live in
docs/benchmark-astronomy-shop.md. The harness is in
scripts/benchmark-rca.mjs; re-run with make benchmark-up && make benchmark-run.
We don't claim universal speedup — the doc spells out exactly where the topology tools help (graph-shaped questions) and where they don't (pure single-metric drill-downs).
Try it in 10 seconds
npx @thotischner/observability-mcp
# then open http://localhost:3000
Wire it into Claude Code with one CLI call:
claude mcp add observability --transport http http://localhost:3000/mcp
…or commit it to your repo as .mcp.json (works the same in Claude Desktop / Cursor):
{
  "mcpServers": {
    "observability": {
      "transport": { "type": "http", "url": "http://localhost:3000/mcp" }
    }
  }
}
The server starts with zero sources. Add Prometheus/Loki via the Web UI or PROMETHEUS_URL / LOKI_URL env vars.
If you'd rather have the snippets above printed by a Make target — including custom-host / custom-port substitution — use
make connect-claude-codeormake connect-cursor.make doctorround-trips a real MCP handshake against a running server, reports the live governance posture (auth mode, redaction, audit-log persistence, per-identity rate cap), and tells you what to fix if it can't.
Multi-user / production? See docs/access-control.md for the opt-in basic-mode login + RBAC + audit log + per-identity rate limit setup. All off by default; the demo above is unchanged.
SSO via OIDC?
make demo-oidcboots a Keycloak + an OIDC-flavored mcp-server on port 3001 with three pre-provisioned users (admin/operator/viewer, password = username, DEMO ONLY). See docs/auth-oidc.md for production Keycloak / Authentik / Auth0 / Azure AD setups.External RBAC via OPA?
make demo-opaboots an Open Policy Agent with an example Rego policy + an OPA-backed mcp-server on port 3002. See docs/policy-engines.md for the built-in / file / OPA backend trade-offs and migration paths.Curated MCP Products? Set
OMCP_PRODUCTS_FILEto a YAML catalog (config/products.yaml.example) and ship per-tenant/per-agent tool bundles instead of "everything, all the time". RBAC-gated, audited, hot-editable. Details in docs/products.md.
Want the full chaos-engineering demo (Prometheus + Loki + 3 example services + the autonomous agent)? Clone and run:
make demo # equivalent to: docker compose --profile demo up --build --wait
Or run the sovereign quickstart — one command, fully on-prem, zero external calls: it starts the stack, injects a real incident, and shows side by side what an agent gets without vs with the analysis layer (a wall of raw numbers vs a scored verdict that pinpoints the culprit). The optional agent reasons over it with a local model (Ollama):
make demo-sovereign
See make help for all canonical workflows.
Why?
Every observability vendor ships its own MCP server — Prometheus, Grafana, Datadog, Elastic, each siloed. An AI agent triaging an incident across systems must juggle N separate servers and learn each query language (PromQL, LogQL, …). There is no unified abstraction layer.
observability-mcp is that layer: one MCP endpoint that normalizes every backend and answers in plain service/metric/log terms, plus an analysis engine that flags anomalies the agent would otherwise have to reconstruct from raw queries itself.
Who it's for: SRE / platform teams running Prometheus + Loki who use an AI agent (Claude, local LLMs, …) for incident triage. The gateway's leverage is largest when the agent is not a frontier model — a smaller or local model that can't reliably hand-write PromQL/LogQL benefits most from normalized tools and pre-computed analysis. A strong frontier model can query raw backends competently on its own; there the value is consistency and the analysis engine, not query convenience. We state this honestly rather than claiming a universal speedup.
Features
- 🔍 Inspect — see, learn & enforce agent behavior — a live service-mesh-style graph of every MCP tool call, an AppArmor-style learning workflow that derives a behavior profile from real traffic, and an enforce mode that blocks calls outside the accepted baseline. Jump to Inspect ↓
- Unified gateway — Single MCP endpoint for all your observability backends.
- Cross-signal analysis — Correlates metrics and logs automatically. Robust anomaly detection (median/MAD baseline, trend detection for slow ramps, warmup + dwell to suppress flapping) and weighted health scoring.
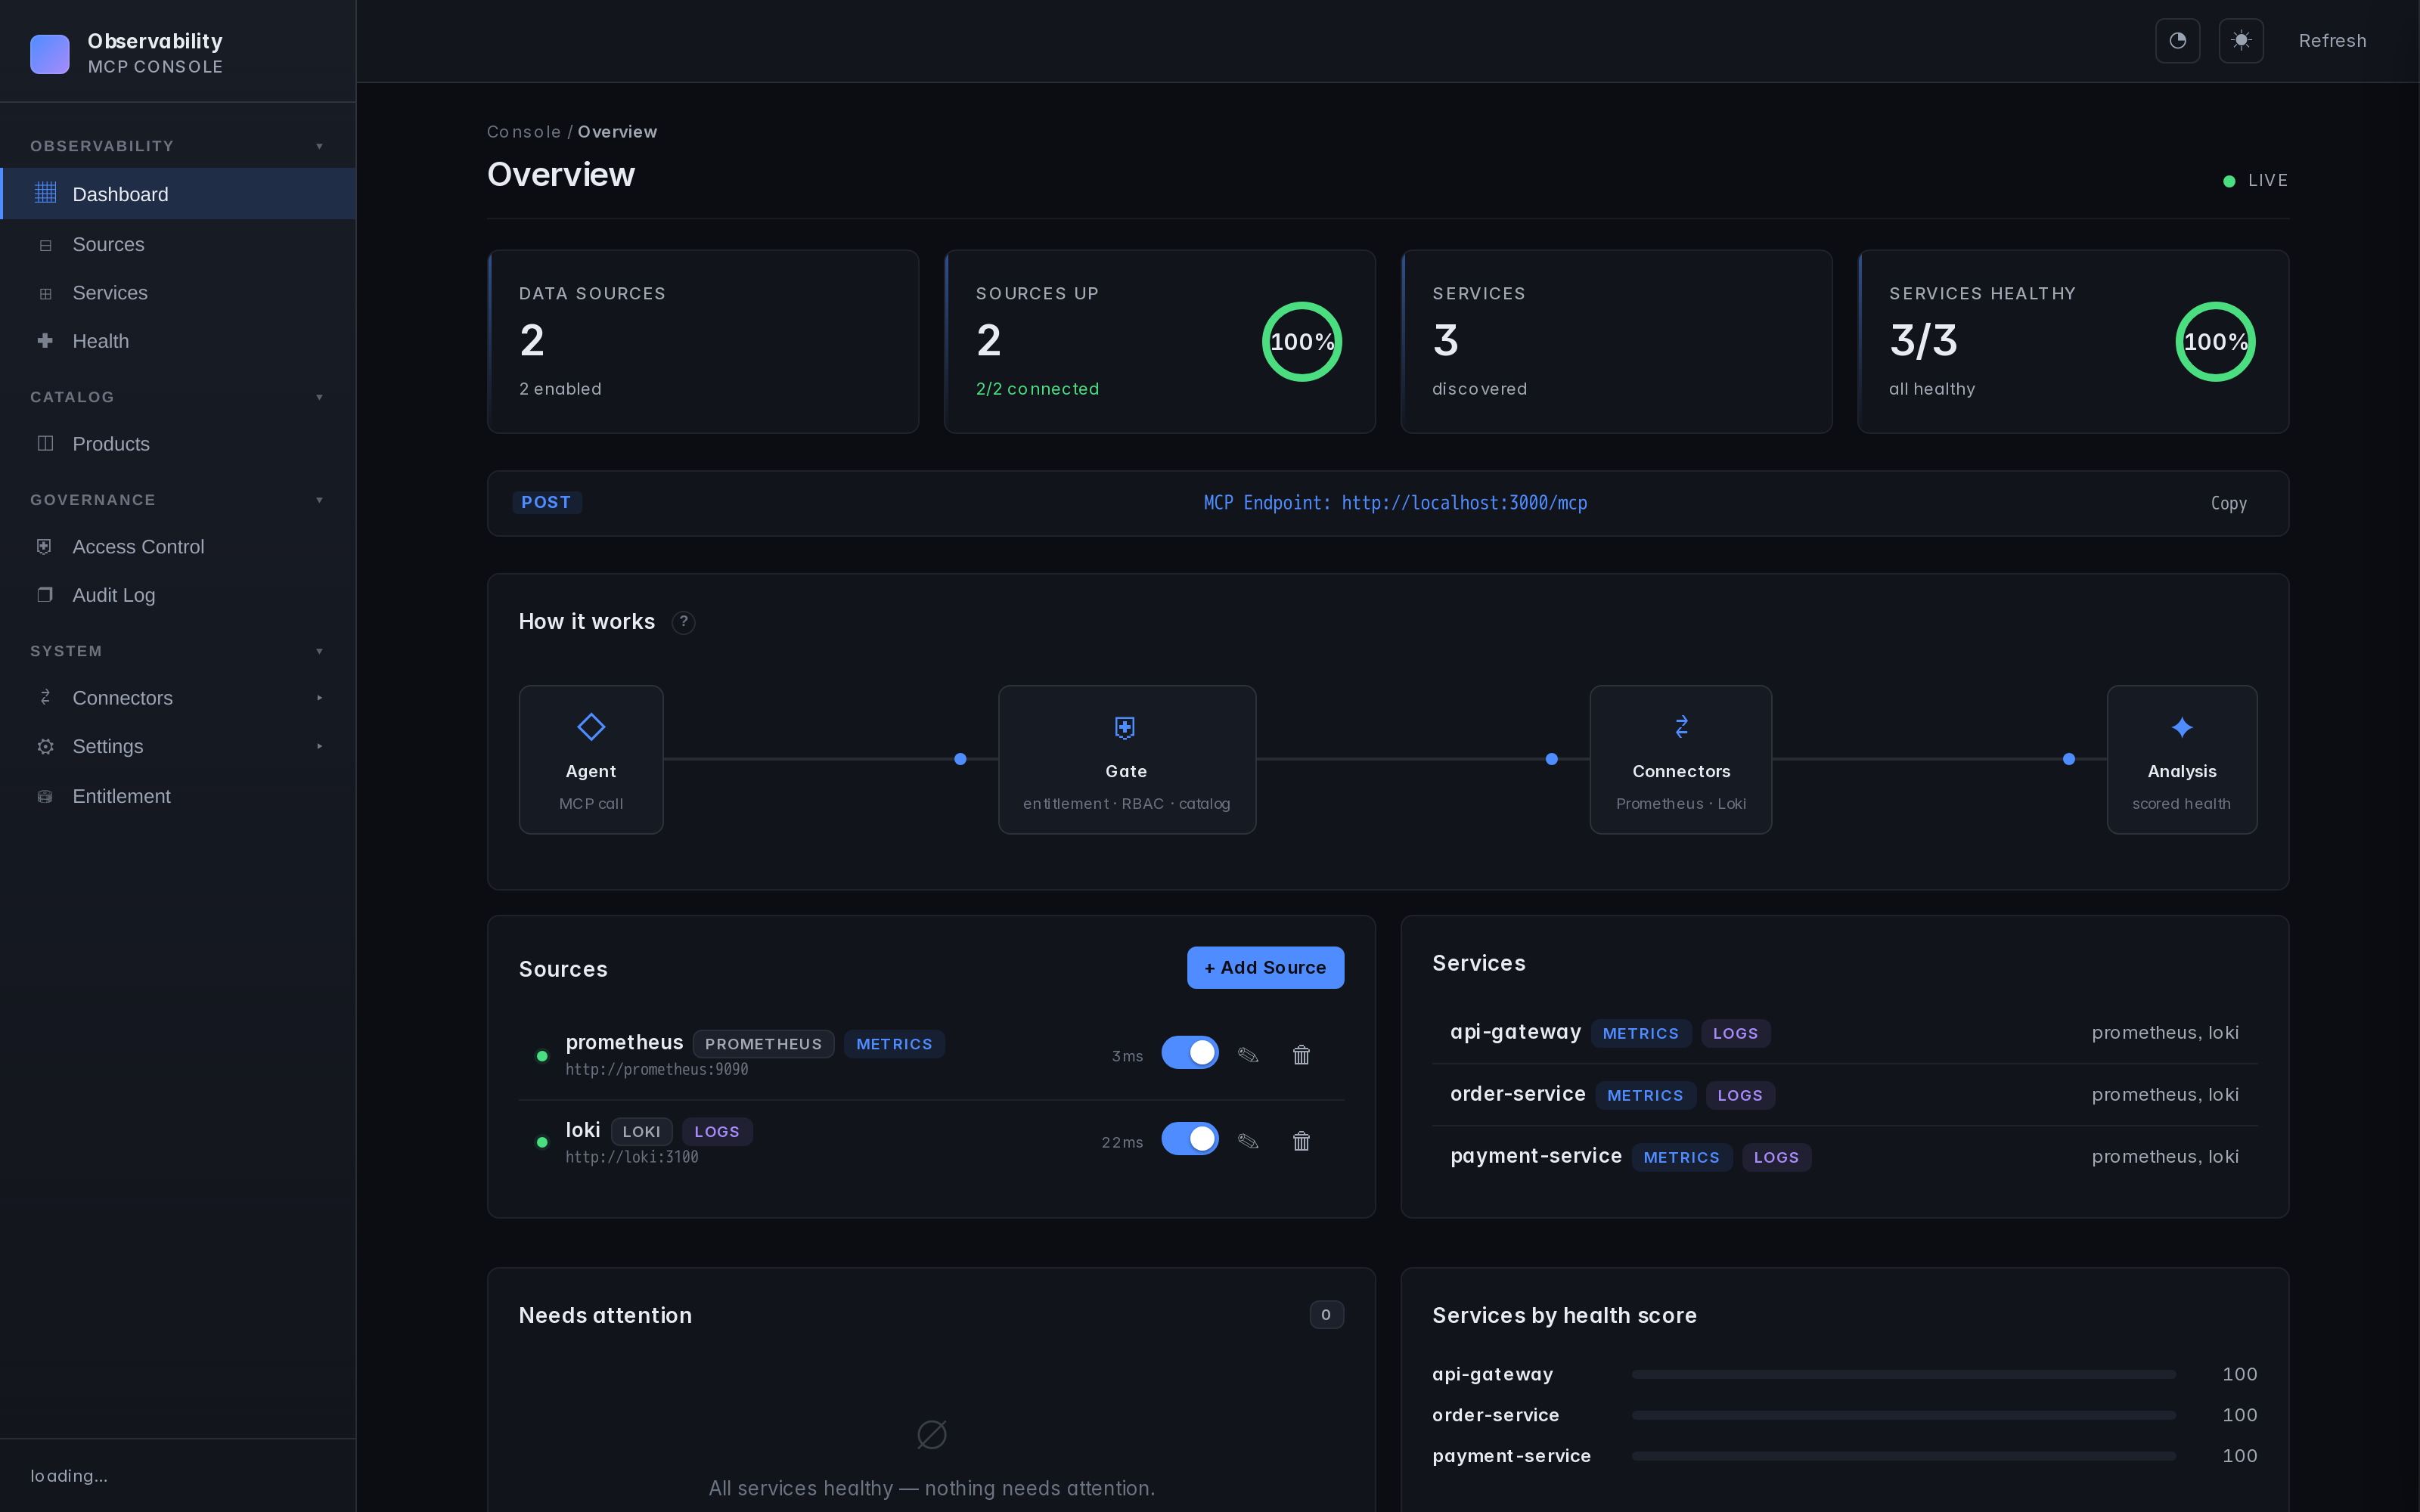
- Web UI — Sources, services, health monitoring, configuration. Real-time, dark theme.
- prom-client defaults — Works out of the box with the standard Node.js Prometheus instrumentation. Dynamic label resolution probes
job/service/app/service_nameso service filtering Just Works. - Loki label fallback — Discovers services through
service_name/service/job/app/container, including Docker-shipped streams with leading slashes. - Pluggable connectors — One interface, any query language (PromQL, LogQL, Flux, KQL...). See docs/connectors.md.
- Auth & TLS — Basic, Bearer, custom CA, mTLS. See docs/auth-and-tls.md.
- Multi-backend — Multiple instances of the same type, no problem.
Inspect — see, learn & enforce agent behavior
You handed an agent (or a CI bot, or a leaked credential) a key to your observability backends. Inspect answers the question RBAC can't: is this call normal for this identity, compared to what it has actually been doing?
It borrows AppArmor's learning workflow and a service-mesh traffic view (think Kiali, for agent tool calls):
   OFF  ──▶  OBSERVE  ──▶  DRY-RUN (complain)  ──▶  ENFORCE
              │              │                        │
        record calls    compute what WOULD be     block calls that
        only (zero      blocked, but still allow   fall outside the
        risk, default)  — review before enforcing   accepted profile
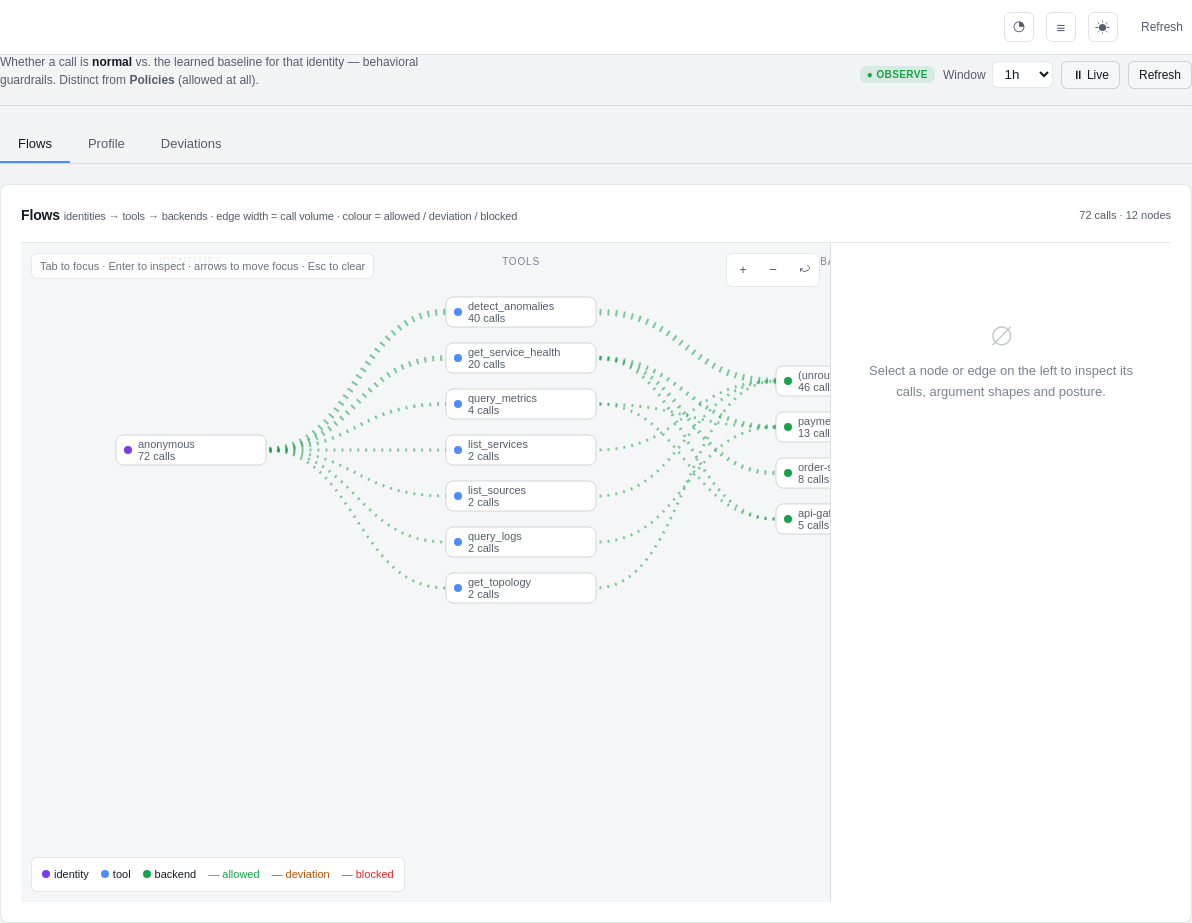
- Flows — a live Identities → Tools → Backends graph. Edge thickness is call volume; colour is allowed / deviation / blocked. Click any node to drill into the real calls, the argument-shape distribution, and turn an observed edge straight into a rule.
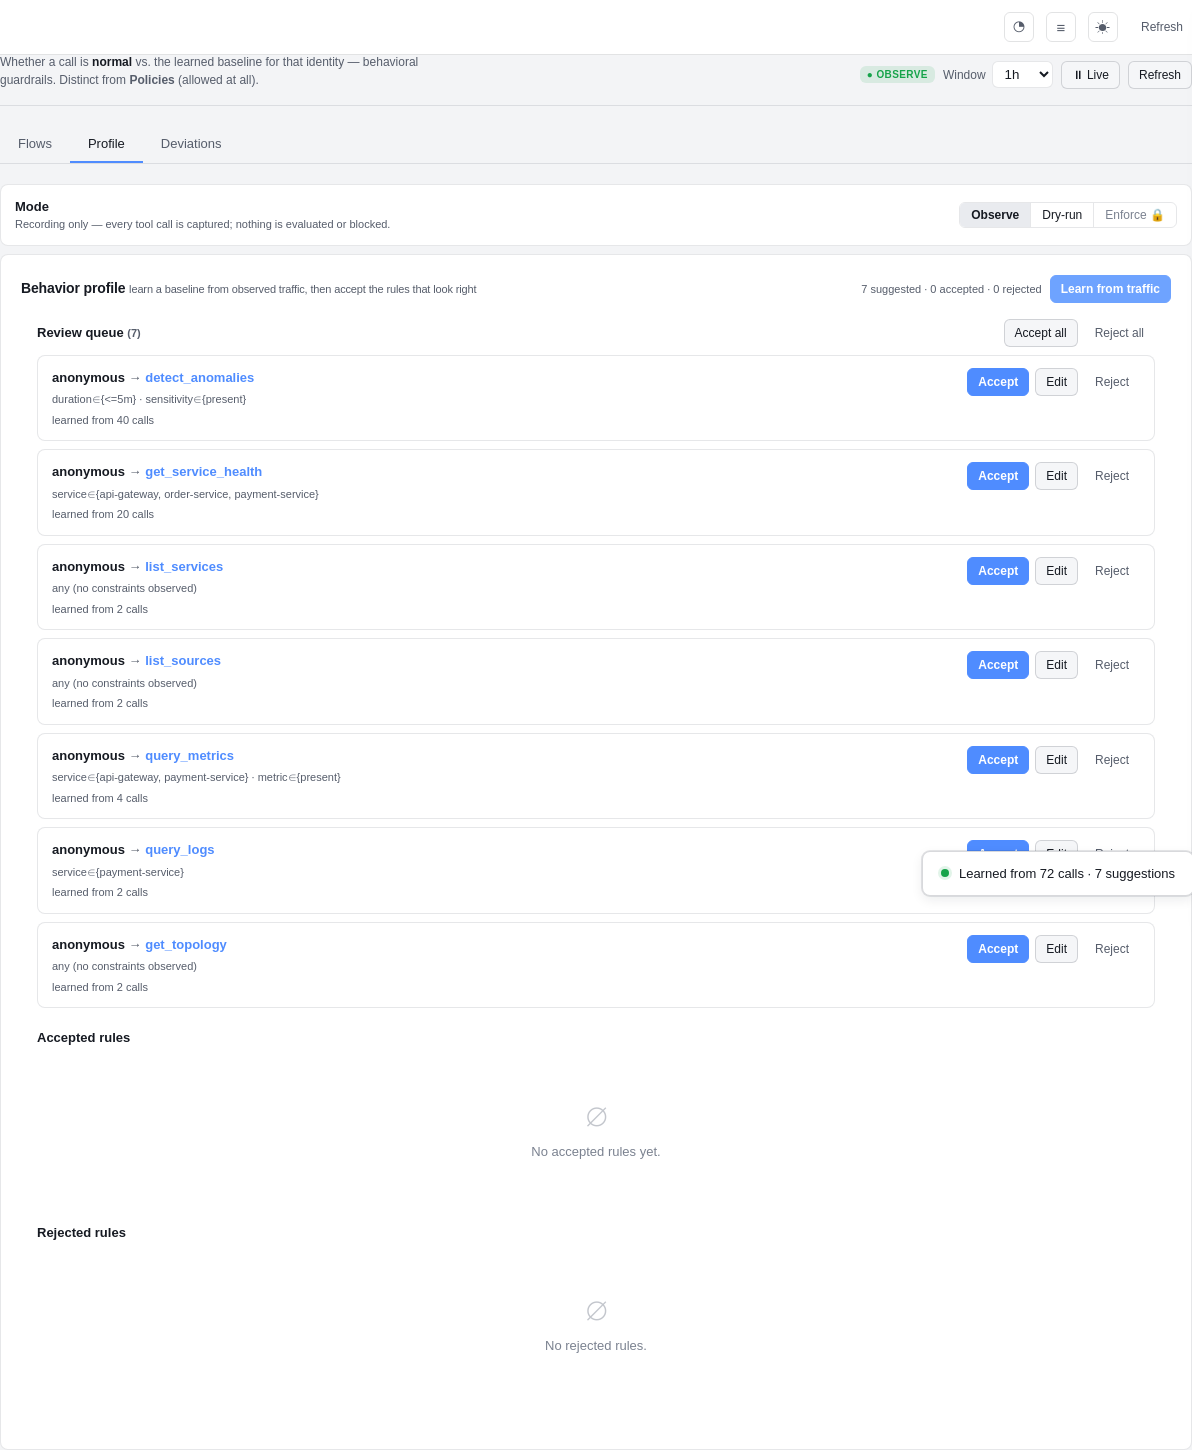
- Profile — the learning loop: hit "Learn from traffic", review the
suggested rules (
anonymous → query_logs · service ∈ {payment-service}— learned from N calls), and accept / edit / reject each one. Only accepted rules ever gate traffic. - Deviations — every call that fell outside the profile: who, which tool, what was unusual — one click to accept into the profile or confirm an anomaly.
Privacy by design: Inspect stores argument shapes, never raw payloads, and runs everything through the gateway's redaction layer first. It makes no outbound calls — the air-gapped guarantee is unchanged.
OSS vs. licensed: observe and dry-run — the live graph, learning a
profile, seeing would-block deviations — are free. Active enforce
blocking is an entitled control (shown with a 🔒 in the UI). Visibility is free;
enforcement is the licensed capability. Full design:
docs/inspect.md.
Detection quality
The anomaly engine is backtested against a labelled synthetic suite covering
slow ramps (memory-leak-toward-OOM), spikes, step changes, stable noise,
transient blips, one-sided recoveries, daily-seasonal patterns, and a
deliberately ambiguous low-SNR "hard" tier. Scored as a CI gate
(backtest.test.ts) — these
numbers are regenerated from that suite, not hand-written:
| Cases | Precision | Recall | F1 |
|---|---|---|---|
| 64 | 100.0% | 87.5% | 93.3% |
Precision is 100% (no spurious alerts); the recalled misses are by design at the noise floor of the hard tier. The suite is deterministic and a detector regression fails CI. Reproduce locally:
docker run --rm -w /app -v "$(pwd)/mcp-server:/app" node:20-alpine \
  sh -c "npm i --silent && npx tsx --test src/analysis/backtest.test.ts"
Screenshots
| Inspect — flow graph | Inspect — learn a profile |
|---|---|
|  |
| Dashboard | Service health | Connector hub |
|---|---|---|
 | 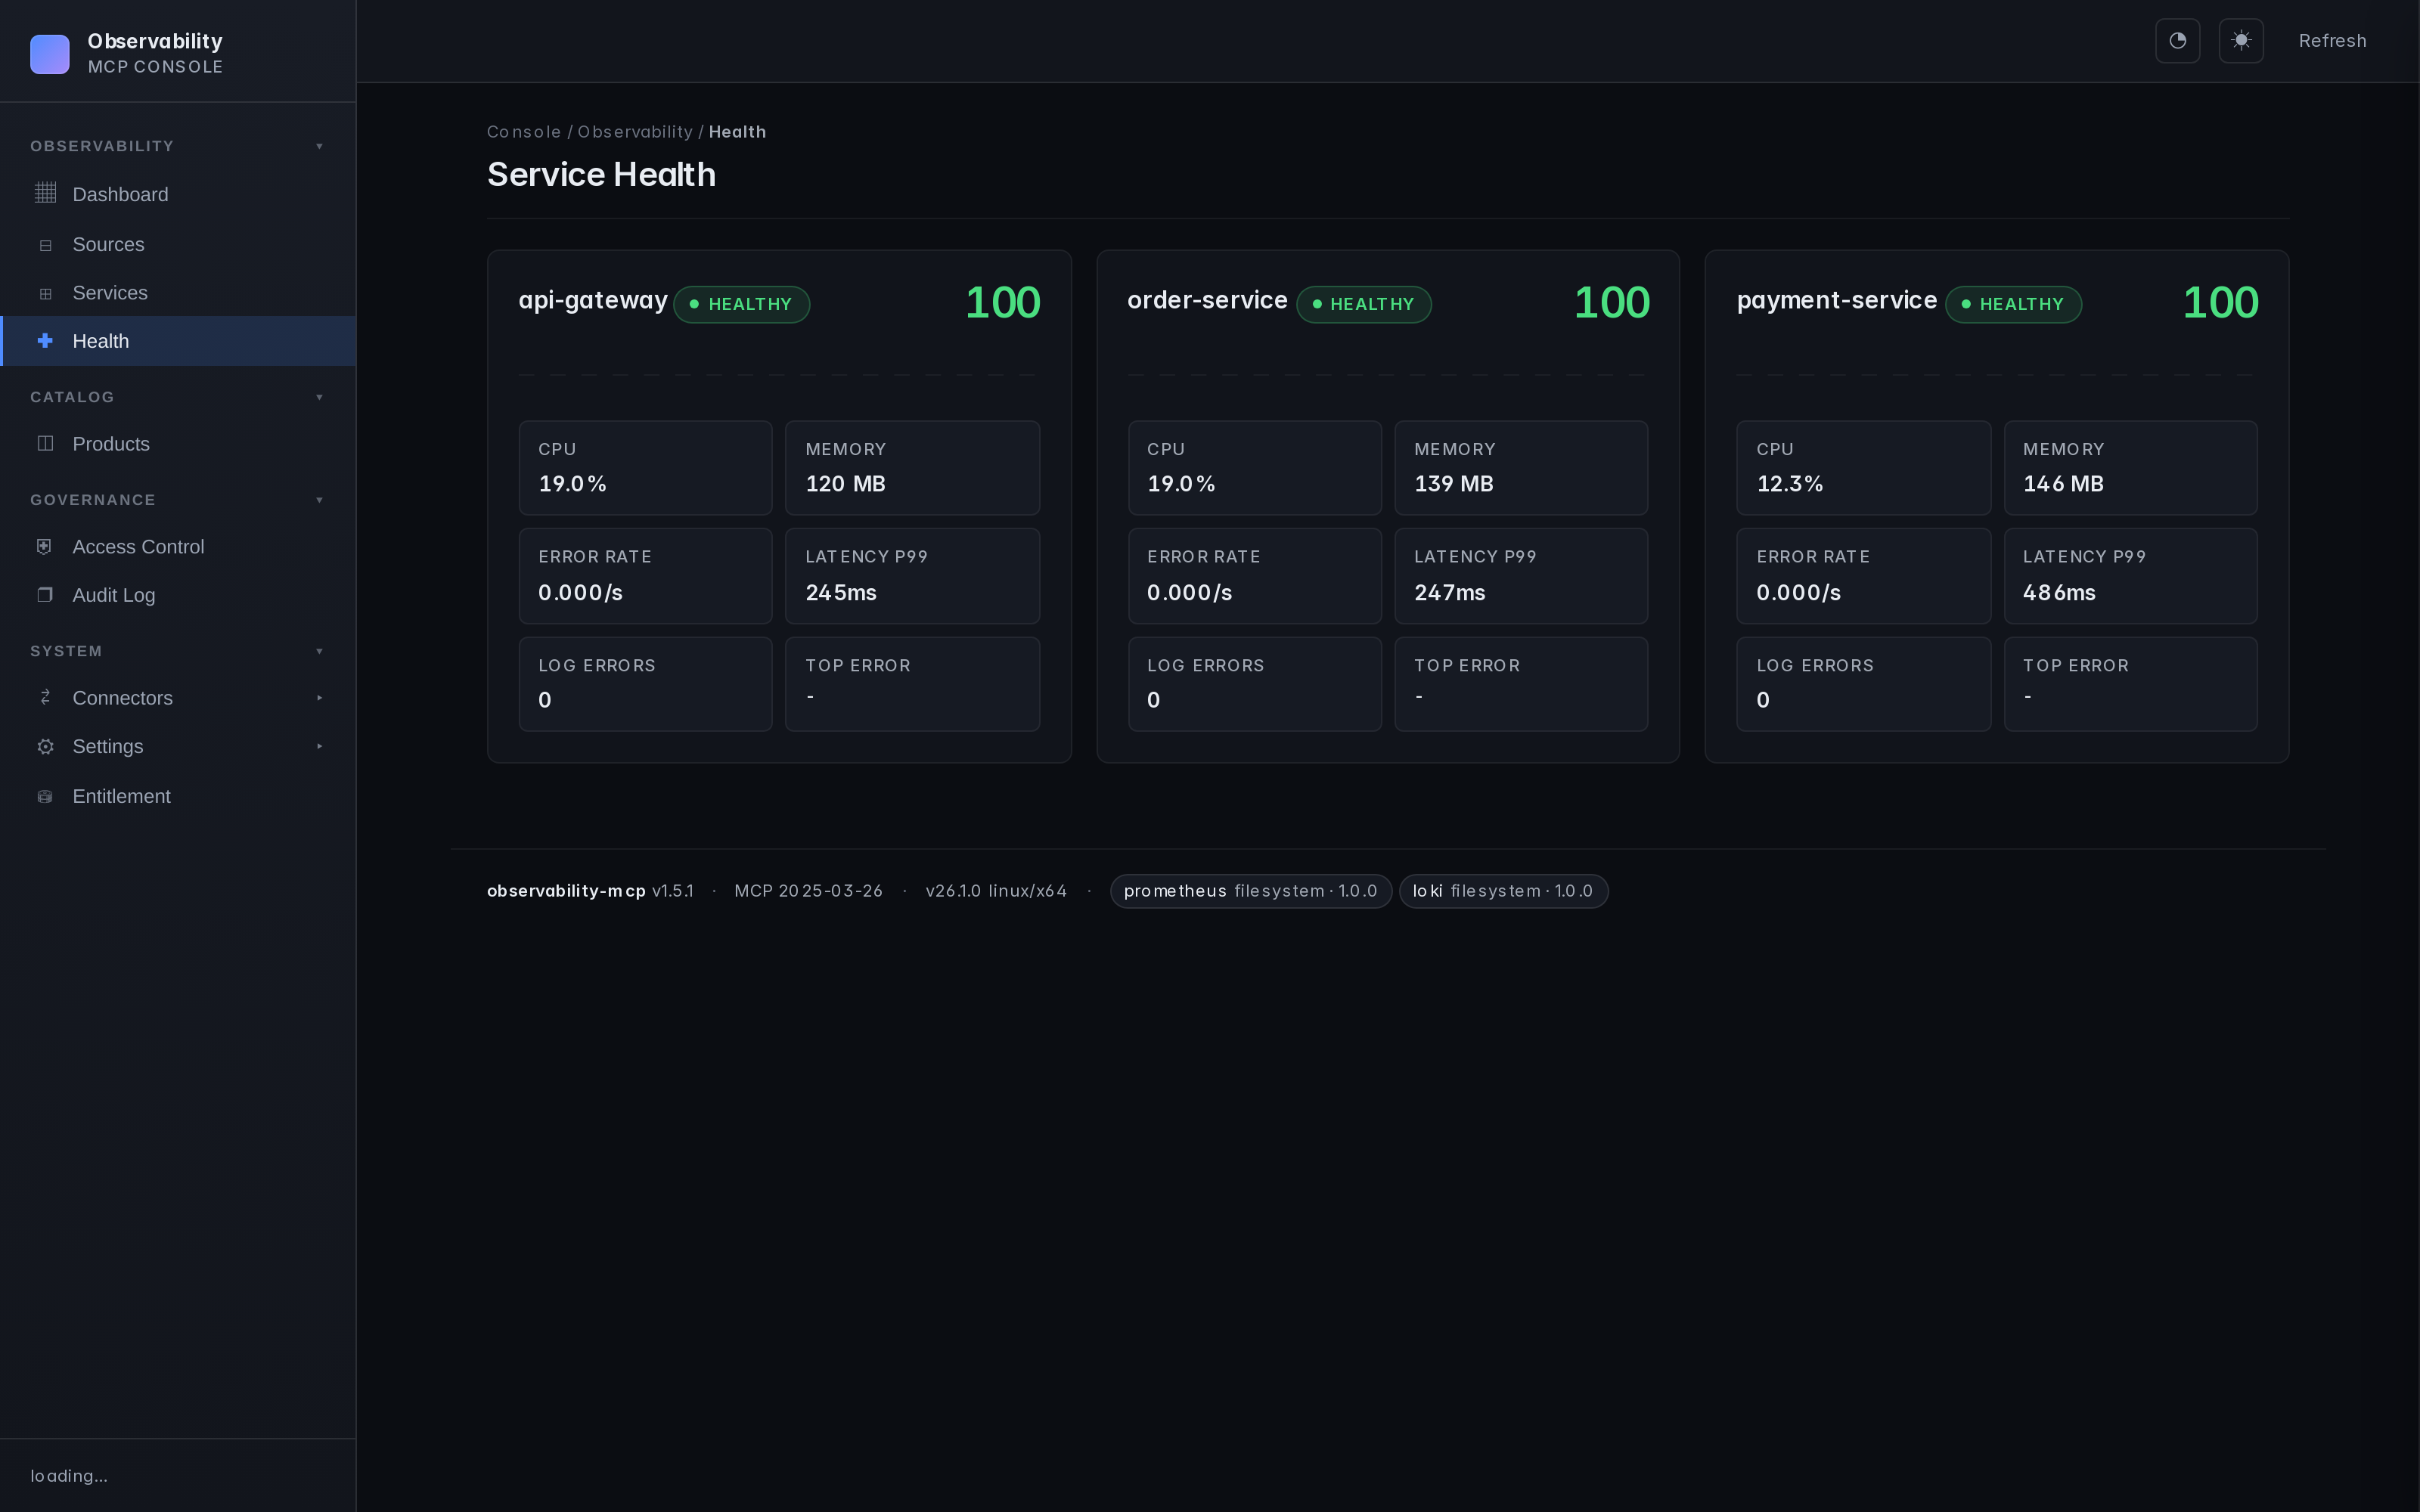 | 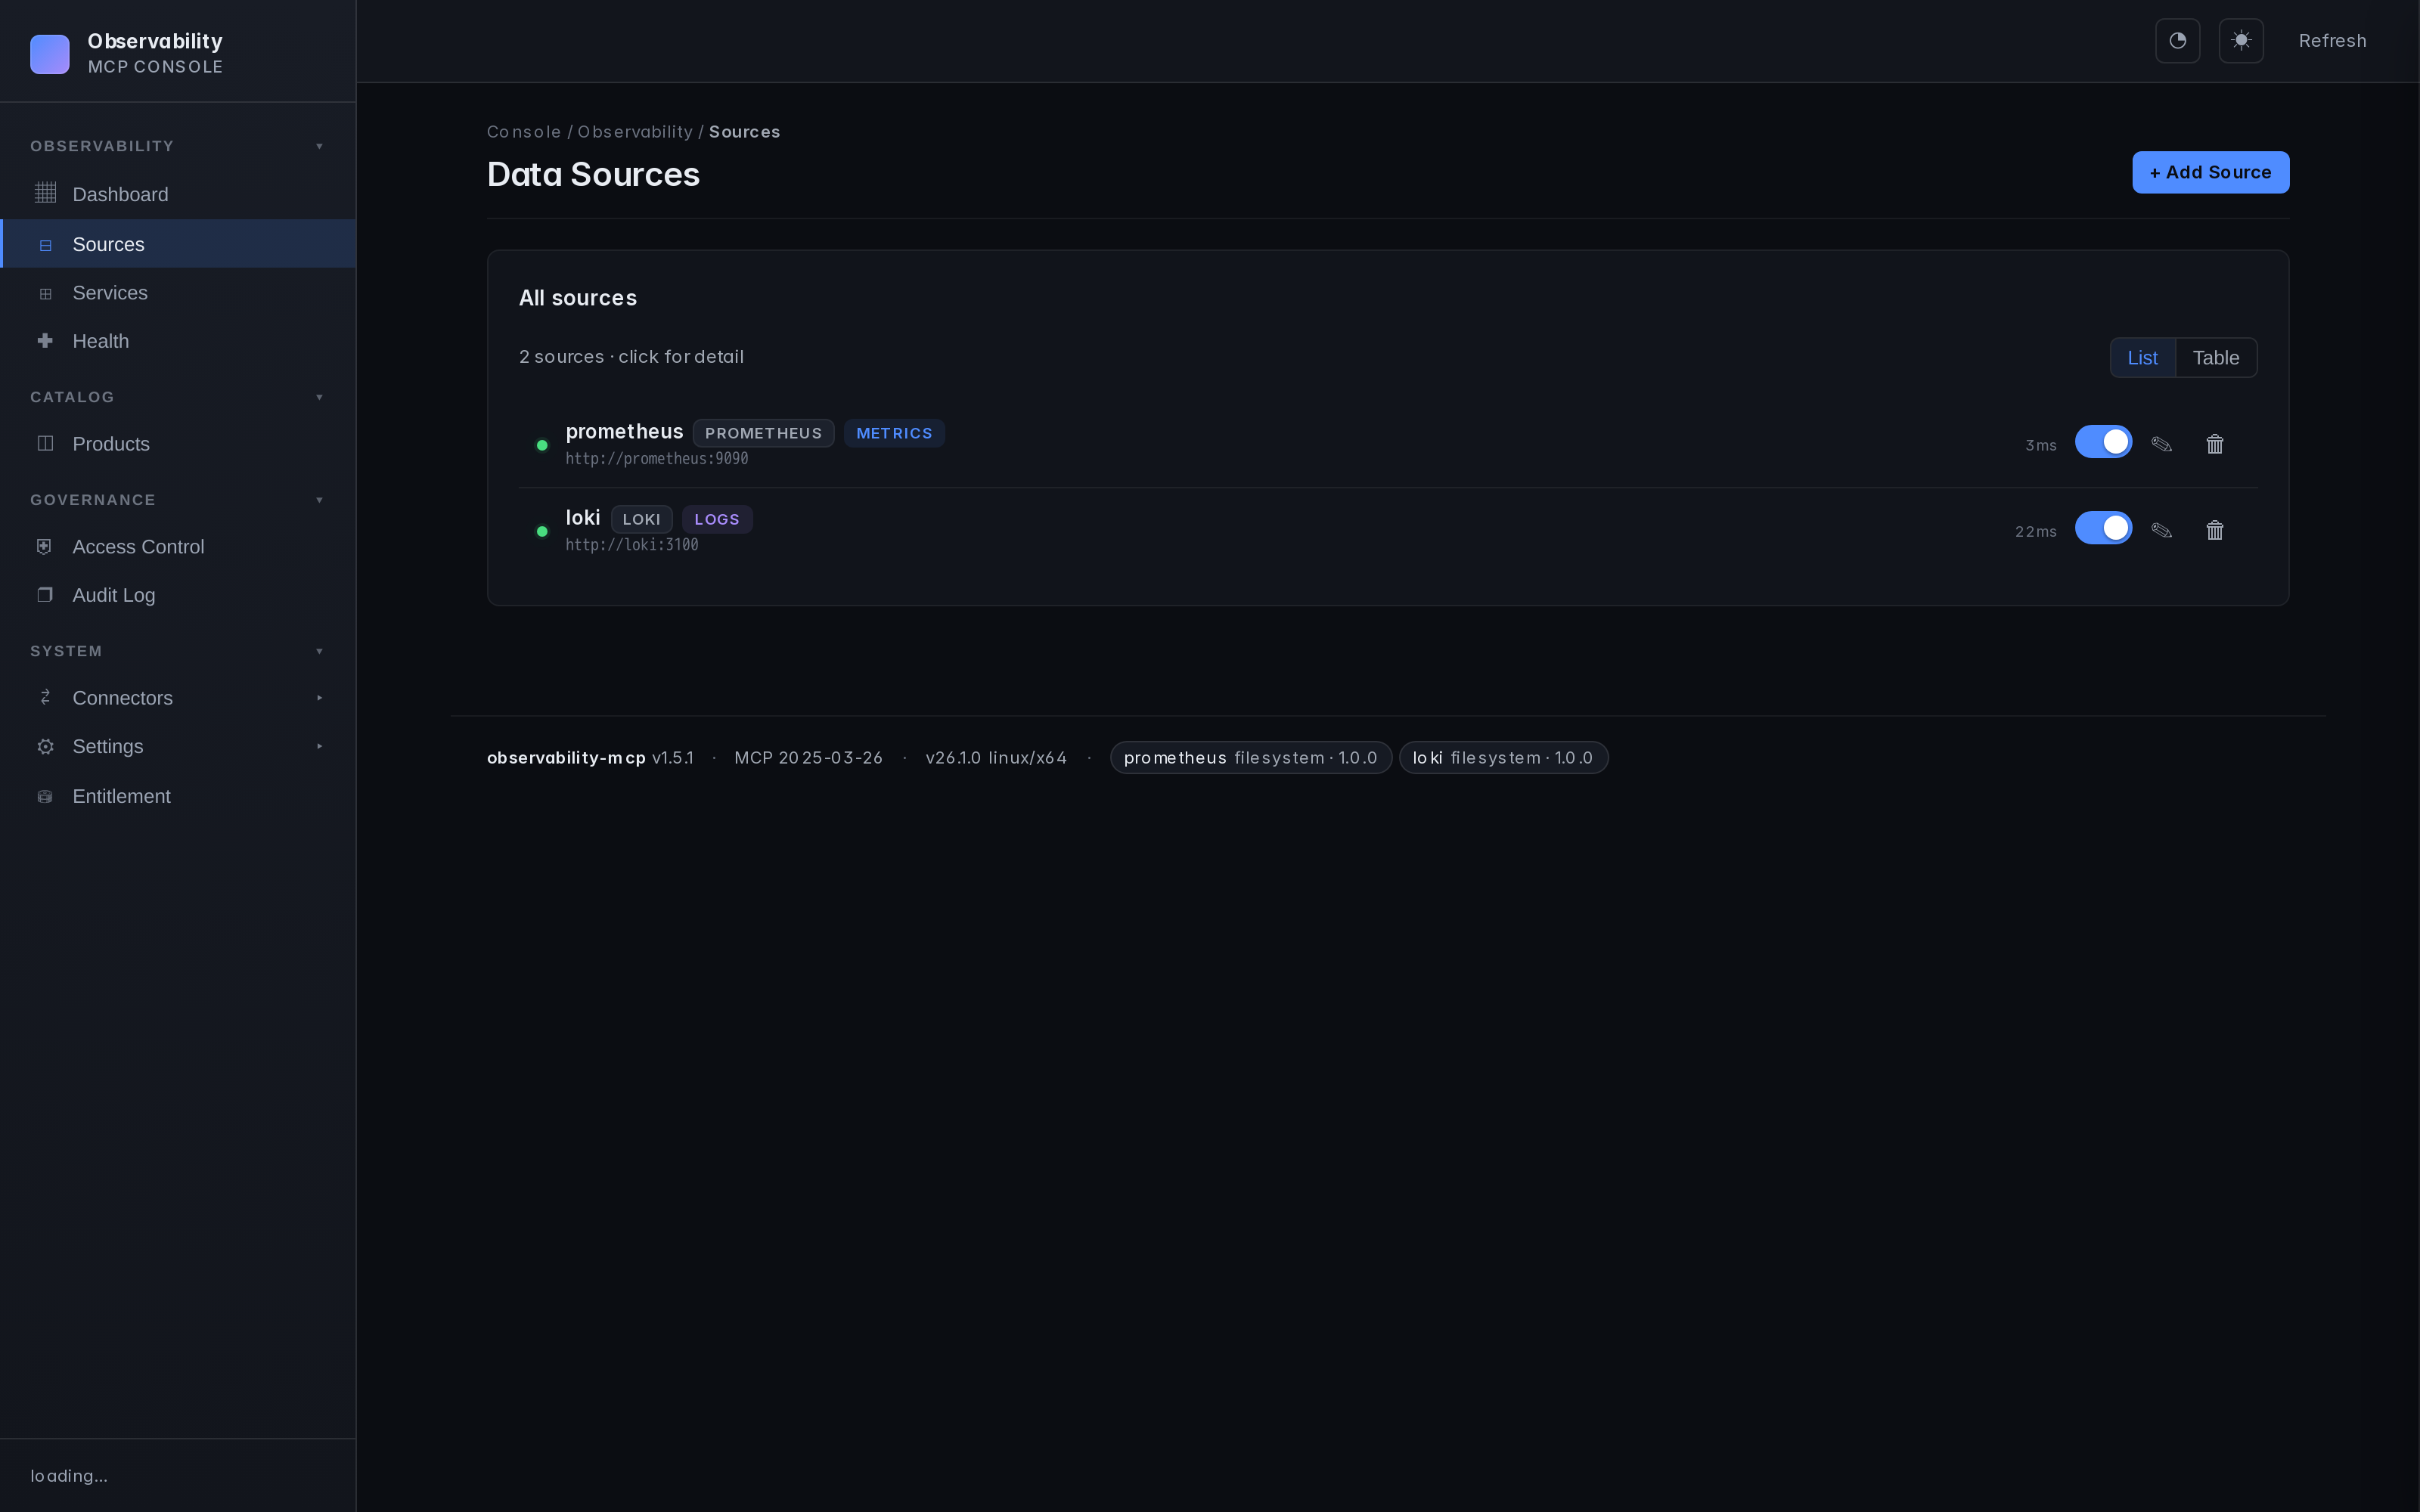 |
Architecture
graph TB
    Agent["AI Agent<br/><small>Claude, Ollama, etc.</small>"]

    subgraph MCP ["observability-mcp :3000"]
        Tools["12 MCP Tools"]
        Analysis["Analysis Engine<br/><small>Robust stats, Health Scoring, Correlation</small>"]
        UI["Web UI"]
    end

    subgraph Connectors ["Pluggable Connectors"]
        Prom["Prometheus<br/><small>PromQL — metrics</small>"]
        Loki["Loki<br/><small>LogQL — logs</small>"]
        K8s["Kubernetes<br/><small>watch — topology</small>"]
        Next["Your Backend<br/><small>Any query language</small>"]
    end

    Agent <-->|"MCP<br/>Streamable HTTP"| Tools
    Tools --- Analysis
    Tools --- UI
    MCP --> Prom & Loki & K8s & Next

    style MCP fill:#1a1a2e,stroke:#58a6ff,color:#fff
    style Connectors fill:#0d1117,stroke:#3fb950,color:#fff
    style Agent fill:#58a6ff,stroke:#58a6ff,color:#000
    style Next fill:#0d1117,stroke:#3fb950,color:#8b949e,stroke-dasharray: 5 5
Repo layout
mcp-server/   # the product — server, Web UI, analysis engine, built-in plugins
helm/         # ArtifactHub-grade Helm chart
docs/         # configuration, auth, plugin architecture, airgapped deployment, ...
examples/     # demo material — agent, example services, Prometheus+Loki configs
mcp-server/ is what you install. Everything under examples/ is opt-in via docker compose --profile demo — it's how the repo demos chaos detection end-to-end, but production deployments don't need any of it.
Installation
| Method | Command | Best for |
|---|---|---|
| npm | npx @thotischner/observability-mcp | Local dev, Node toolchains, zero install |
| Docker (GHCR) | docker run -p 3000:3000 ghcr.io/thotischner/observability-mcp:latest | Production hosts, isolation |
| Helm | helm repo add observability-mcp https://thotischner.github.io/observability-mcp/helm install observability-mcp observability-mcp/observability-mcp | Kubernetes |
| From source | git clone … && make demo | Full POC with example services and chaos |
CLI (omcp) | npm i -g @thotischner/observability-mcp | Managing connectors, the demo stack & Helm from the terminal — see CLI |
GHCR is multi-arch (amd64 + arm64). Available tags: latest, main, X.Y.Z, X.Y, X, sha-<commit>. Note: the leading v is stripped from semver tags.
Helm chart
The chart ships with Deployment, Service, optional Ingress/PVC/HPA, NetworkPolicy, ServiceMonitor (auto-gated on the Prometheus Operator CRD), helm test connection probe, and values.schema.json validation. ArtifactHub-grade annotations. See helm/observability-mcp/ for the full values reference, or the airgapped deployment guide for a hardened production example.
helm repo add observability-mcp https://thotischner.github.io/observability-mcp/
helm repo update
helm install observability-mcp observability-mcp/observability-mcp \
  --set sources.prometheusUrl=http://prometheus.monitoring.svc.cluster.local:9090 \
  --set sources.lokiUrl=http://loki.logging.svc.cluster.local:3100
# docker-compose snippet
services:
  observability-mcp:
    image: ghcr.io/thotischner/observability-mcp:latest
    ports: ["3000:3000"]
    environment:
      PROMETHEUS_URL: http://prometheus:9090
      LOKI_URL: http://loki:3100
    volumes:
      - ./mcp-config:/home/node/.observability-mcp
    restart: unless-stopped
For full configuration — paths, env vars, ${VAR} substitution, complete sources.yaml reference — see docs/configuration.md.
Quick Start
Option A: Standalone (your own backends)
npx @thotischner/observability-mcp
Then open the Web UI at http://localhost:3000, click Sources → + Add Source, point at your Prometheus/Loki URLs. Or skip the UI:
PROMETHEUS_URL=http://localhost:9090 LOKI_URL=http://localhost:3100 \
  npx @thotischner/observability-mcp
Option B: Grafana Cloud
Grafana Cloud uses Basic Auth with your numeric instance ID as username and an API token as password. The instance ID for Prometheus and Loki is different — find both in Connections → Data sources.
# ~/.observability-mcp/sources.yaml
sources:
  - name: grafana-cloud-prom
    type: prometheus
    url: https://prometheus-prod-XX-prod-eu-west-X.grafana.net/api/prom
    enabled: true
    auth:
      type: basic
      username: "${GRAFANA_PROM_USER}"   # numeric instance ID
      password: "${GRAFANA_TOKEN}"
  - name: grafana-cloud-loki
    type: loki
    url: https://logs-prod-XXX.grafana.net
    enabled: true
    auth:
      type: basic
      username: "${GRAFANA_LOKI_USER}"   # different from Prom!
      password: "${GRAFANA_TOKEN}"
GRAFANA_PROM_USER=… GRAFANA_LOKI_USER=… GRAFANA_TOKEN=glc_… \
  npx @thotischner/observability-mcp
Option C: Full demo (Docker Compose with example services)
git clone https://github.com/ThoTischner/observability-mcp.git
cd observability-mcp
docker compose --profile demo up --build
Boots a single-node k3s cluster, builds the three example services and runs them as Kubernetes Deployments inside k3s, plus Prometheus, Loki, Promtail, the MCP server and the agent on the docker-compose side. Open http://localhost:3000.
The same Deployments that Prometheus scrapes and Loki receives logs from are also what the topology graph shows — so the agent can correlate a metric/log anomaly with its underlying host using get_blast_radius. Chaos endpoints stay on localhost:8080/8081/8082 (mapped to the k3s NodePorts) so existing scripts and demo videos keep working unchanged.
Without --profile demo, only mcp-server starts — useful when you already run Prometheus/Loki elsewhere and just want to expose them via MCP.
Option D: Benchmark mode (OpenTelemetry Demo / Astronomy Shop)
For producing credible RCA numbers against a real microservice workload (~23 services, native OTel instrumentation):
make benchmark-up         # clones upstream Astronomy Shop, brings up both stacks
make benchmark-run        # runs the harness baseline vs topology, writes JSON
make benchmark-down       # tears down
make benchmark-up adds Tempo + an OTel collector bridge under our --profile benchmark and orchestrates the upstream stack in a separate compose project, joining their network to ours so Astronomy Shop services push traces into our Tempo. See docs/benchmark-astronomy-shop.md and examples/benchmark/README.md. First-time pull is ~4 GB.
MCP Tools
| Tool | Signal | Purpose |
|---|---|---|
list_sources | meta | Discover configured backends and connection status |
list_services | meta | Discover monitored services across all backends |
query_metrics | metrics | Query metrics with pre-computed summary stats |
query_logs | logs | Query logs with error/warning counts and top patterns |
get_service_health | unified | Health score combining metrics + logs (0–100) |
detect_anomalies | unified | Cross-signal anomaly detection with robust (median/MAD + trend) analysis |
get_topology | topology | Return the merged infrastructure graph (resources + edges) from every topology-capable connector, filterable by source/kind/scope |
get_blast_radius | topology | Pivot on the universal RUNS_ON relation — "if this resource's host fails, who else fails?". Works for pod→node, vm→hypervisor, container→host |
The two topology tools require a topology-capable connector. The bundled Kubernetes connector is the first; future connectors (vCenter, NetBox, …) plug in via the same isTopologyProvider interface and emit kind/relation values from the canonical topology vocabulary.
Using with Claude Code
Connect Claude Code directly — no agent needed.
CLI:
claude mcp add observability --transport http http://localhost:3000/mcp
Or .mcp.json in your project root (commit-friendly):
{
  "mcpServers": {
    "observability": {
      "transport": { "type": "http", "url": "http://localhost:3000/mcp" }
    }
  }
}
Then ask Claude in natural language. For example, after triggering chaos in the demo (curl -X POST http://localhost:8081/chaos/error-spike):
"Are there any anomalies right now?"
Claude calls detect_anomalies and finds:
{
  "anomalies": [
    { "metric": "cpu", "severity": "high", "service": "payment-service",
      "description": "cpu is 3.4σ above baseline (18.36 → 37.31)" },
    { "metric": "request_rate", "severity": "low", "service": "payment-service",
      "description": "request_rate is -1.8σ below baseline (0.08 → 0.04)" }
  ]
}
"Show me the error logs for payment-service."
Claude calls query_logs:
{
  "summary": {
    "total": 11, "errorCount": 11,
    "topPatterns": [
      "Request failed: internal error during POST /payments (6x)",
      "Request failed: internal error during POST /refunds (4x)"
    ]
  }
}
Claude correlates the signals — CPU spike, error logs flooding, request rate halved — and explains the incident in plain language. No PromQL, no LogQL.
Demo: Chaos Engineering
Three example microservices generate traffic and support chaos injection:
curl -X POST http://localhost:8081/chaos/high-cpu        # CPU spike
curl -X POST http://localhost:8081/chaos/error-spike     # CPU + latency + errors
curl -X POST http://localhost:8081/chaos/slow-responses  # Latency
curl -X POST http://localhost:8081/chaos/memory-leak     # OOM logs
curl -X POST http://localhost:8081/chaos/reset
The agent (docs/agent.md) detects anomalies within 30 seconds and produces an LLM incident analysis if Ollama is running.
CLI (omcp)
A control CLI ships in the same npm package (omcp bin) — manage connectors, the demo stack, and Helm installs.
Install it (or run ad-hoc without installing):
npm i -g @thotischner/observability-mcp   # puts `omcp` on your PATH
omcp --help

# or, no install:
npx -p @thotischner/observability-mcp omcp doctor
Then:
omcp doctor                       # check docker / compose / helm / node
omcp demo up                      # full demo stack (auto-picks free host ports)
omcp plugin list                  # browse the connector hub catalog
omcp plugin install tempo@1.2.0 --trust-root key.pem    # download + verify + extract
omcp plugin verify ./plugins/tempo --trust-root key.pem # offline audit
omcp helm upgrade obs -- -n monitoring --set sources.prometheusUrl=http://prom:9090
Plugin install/verify reuse the server's fail-closed signature + integrity
checks (offline-capable; --offline-dir for airgapped). Extra helm
flags pass through after a literal --.
Docs
- Configuration — paths, env vars,
${VAR}substitution, fullsources.yamlreference - Authentication & TLS — Basic, Bearer, custom CA, mTLS
- Management-plane auth (basic mode) — optional login screen + signed session cookies for the Web UI /
/api/*plane - Log redaction — PII / secret patterns automatically masked in
query_logsoutput before it reaches the agent; opt-out viaOMCP_REDACTION=off - Access control overview + runbook — RBAC roles, audit chain, per-identity rate limits, service catalog enrichment, and an investigation runbook for the most common "who / why" questions
- Prometheus — defaults, label resolution,
resolvedSeries, prom-client compatibility - Loki — label fallback, Docker container slash, managed Loki
- Connectors — write your own backend
- Agent — Ollama setup, loop behavior
- Troubleshooting — common pitfalls and fixes
- Security — automation pipeline, vulnerability reporting, built-in protections
- Airgapped deployment — mirroring images, private plugins, GitOps-friendly config
- Topology vocabulary — the canonical
kind/relationcontract every topology-capable connector emits, plus the warn-only validator - RCA benchmark — reproducible A/B harness; on a cross-namespace blast-radius question (llama3.1:8b, n=10) the baseline tool set scores 0/10 and hallucinates the wrong entity type, the same model with topology tools scores 10/10 deterministically — see the three-scenarios table for the full honest picture
- How this compares to adjacent tools — source-cited table vs. Datadog Bits AI, HolmesGPT, Robusta — what each is best at and where this fits
- Governance access-control gate — optional RBAC / catalog / audit behind a signed entitlement token (off by default)
- Connector Hub — browse versioned, signed connectors (catalog:
hub/) - Use cases — five scenarios with the prompts that drive them
Endpoints
| Service | URL |
|---|---|
| MCP Server (Streamable HTTP) | http://localhost:3000/mcp |
| Web UI | http://localhost:3000 |
| Health API | http://localhost:3000/api/health |
In the docker-compose demo: Prometheus on :9090, Loki on :3100. The three example services run as Kubernetes Deployments inside the in-compose k3s and are reachable on the host via the NodePort mapping :8080–:8082 — same URLs as before the k8s migration, so existing chaos commands keep working.
Transports: Streamable HTTP by default (/mcp). For stdio-based clients/catalogs (Claude Desktop, Glama's mcp-proxy, etc.) run with --stdio (or MCP_TRANSPORT=stdio) — one MCP server over stdin/stdout, all logs on stderr so the protocol stream stays clean.
Tech Stack
TypeScript + Node 20, @modelcontextprotocol/sdk (Streamable HTTP), Express, Zod, js-yaml, prom-client (example services), Prometheus, Loki, Promtail, Docker Compose, optional Ollama.
Requirements
- Standalone: Node 20+ (or just
npx) - Docker demo: Docker + Compose, 4 GB+ RAM (8 GB+ with Ollama)
- Optional: Ollama on the host for the agent's LLM analysis
Contributing
- Fork the repo and
docker-compose up --build. - Pick an issue or open one to discuss your idea.
- Submit a PR — all code runs in Docker, no local deps.
Ideas: new connectors (InfluxDB, Elasticsearch, Datadog), additional analysis algorithms, UI improvements.
License
Apache License 2.0 — see also NOTICE.
Releases up to and including the last MIT-licensed version remain available under MIT; subsequent releases are Apache-2.0. Contributions require a Contributor License Agreement.
If you find this useful, consider giving it a star — it helps others discover the project.