Kapture
Una extensión de Chrome DevTools que permite la automatización del navegador a través del Protocolo de Contexto de Modelo (MCP) para aplicaciones de IA.
Documentación
Kapture - Browser Automation via Chrome DevTools
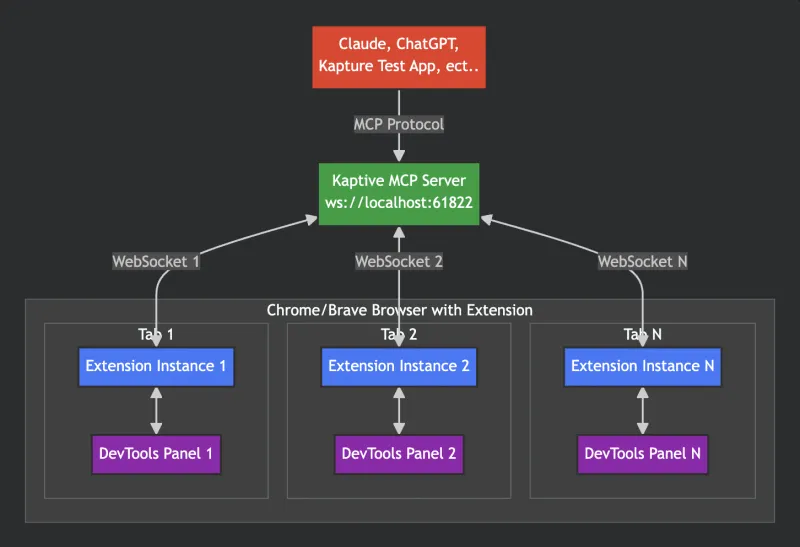
Kapture is a Chrome DevTools Extension that enables browser automation through the Model Context Protocol (MCP). It allows AI applications like Claude to control web browsers via a three-layer architecture.
✨ Key Feature: Multiple AI clients can connect to the same server! Claude Desktop, Cline, and other MCP clients can all control browser tabs through a single server instance.
Available in the Chrome Web Store
Overview
Kapture bridges AI assistants with web browsers through:
- MCP Server: Handles MCP protocol communication
- Chrome Extension: Background service worker executes browser automation commands (DevTools does not need to be open)
- WebSocket Bridge: Real-time communication between server and extensions
- Multi-Client Support: Multiple AI clients can connect simultaneously via WebSocket
Architecture
Quick Start
1. Install Dependencies
# Server
cd server
npm install
npm run build

# Test App (optional)
cd test-app
npm install
2. Install Chrome Extension
Option A: Install from Chrome Web Store (Recommended)
- Visit the Kapture Chrome Web Store page
- Click "Add to Chrome"
- Confirm the installation
Option B: Load Unpacked (Developer Mode)
- Open Chrome and navigate to
chrome://extensions/ - Enable "Developer mode"
- Click "Load unpacked"
- Select the
extensionfolder
3. Start MCP Server
Configure your AI client and open it. It will start the MCP server automatically.
OR
Run the Test App:
cd test-app
npm run dev
The server starts on port 61822.
# Server
cd server
npm start

# Test App
cd test-app
npm start
4. Connect a Tab
- Open any website in Chrome
- Click the Kapture toolbar icon and flip the connection toggle
- The extension connects to the server on port 61822 (the badge shows ✓ when connected)
Alternatively, connect from the "Kapture" panel in DevTools, or load a page with ?kapture-connect=true in the URL to auto-connect.
Using with Claude Desktop
Add to your Claude Desktop config:
Option 1: Using the bridge command (Recommended)
This single command starts the server and handles stdio-to-WebSocket translation:
{
  "mcpServers": {
    "kapture": {
      "command": "npx",
      "args": ["-y", "kapture-mcp@latest", "bridge"]
    }
  }
}
Option 2: Direct WebSocket connection (Advanced)
For advanced use cases where you need manual server control:
- Start the server manually:
npx kapture-mcp
- Configure Claude Desktop to connect via WebSocket:
{
  "mcpServers": {
    "kapture": {
      "transport": "websocket",
      "url": "ws://localhost:61822/mcp"
    }
  }
}
Note: This approach requires manually managing the server lifecycle. Use Option 1 (bridge command) for most use cases.
🚀 Run Multiple AI Assistants Simultaneously
Kapture supports multiple MCP clients connecting to the same server! You can run Claude Desktop, Cline, and other MCP clients simultaneously through a single server instance.
How It Works
- All MCP clients connect via WebSocket to
ws://localhost:61822/mcp - All MCP clients share access to the same browser tabs
- Notifications are broadcast to all connected clients
Smart Server Detection
When running npx kapture-mcp, the command automatically detects if a server is already running:
- No existing server: Starts a new server on port 61822
- Server already running: Shows connection information and exits gracefully
This prevents errors and confusion when multiple clients try to start servers.
Setting Up Multiple Clients
Each client should use the same bridge command configuration:
Claude Desktop:
{
  "mcpServers": {
    "kapture": {
      "command": "npx",
      "args": ["-y", "kapture-mcp@latest", "bridge"]
    }
  }
}
Cline/VS Code:
{
  "cline.mcpServers": {
    "kapture": {
      "command": "npx",
      "args": ["-y", "kapture-mcp@latest", "bridge"]
    }
  }
}
Other MCP Clients:
Use the same configuration pattern with "command": "npx" and "args": ["-y", "kapture-mcp@latest", "bridge"].
See the complete multi-assistant guide →
Benefits of Multiple AI Assistants:
- Parallel Workflows: Have Claude Desktop research while Cline develops code
- Specialized Tasks: Use different AI clients for different types of automation
- Team Collaboration: Multiple team members can use their preferred AI tools simultaneously
- Testing & Development: Test automation scripts with one AI while developing with another
Then ask Claude to interact with web pages:
- "Navigate to example.com and take a screenshot"
- "Click the search button"
- "Fill in the email field with [email protected]"
Available MCP Tools
navigate- Navigate to URLback- Browser back buttonforward- Browser forward buttonreload- Reload the current page (similar to pressing F5)click- Click elements (uses first matching element, returns unique selector)hover- Hover over elements (uses first matching element, returns unique selector)fill- Fill input fields by setting value directly (uses first matching element, returns unique selector)type- Type a string as individual keystrokes (real key events; works on "fake" inputs that ignore element.value)insertText- Insert a whole string at once (fires input events but no per-key events; good for bulk text and editors like Google Docs)clear- Clear a text field via select-all + Backspace (real key events; works on "fake" inputs)select- Select dropdown options (HTML<select>only, uses first matching element, returns unique selector)keypress- Send keyboard events to the page or specific elements (supports modifier keys)scroll- Scroll an element into view (selector/xpath) or to an absolute x/y document coordinateelements- Query all elements matching a CSS selector or XPath with optional visibility filteringconsole_logs- Get the tab's console contents (console messages, uncaught exceptions, browser-generated entries)watch_console- Watch the console in real time for a required timeout (ms), then return everything logged during the windownetwork_monitor- Turn network monitoring on/off for a tab (enabledboolean). While on, every request's metadata is captured into a per-tab buffer. Watchers are tracked by client identity: enable is idempotent, monitoring stays on until every watcher disables (orforce:true), and disconnected clients are released automatically. The buffer clears when monitoring fully stops. Enable it before the traffic you want to observe — capture has no history. (Extension 1.1.0+)network_requests- List the captured requests; each carries arequestId, a monotonicseq, andhasPostDatawhen the request had a payload. Poll incrementally by passing the prior call'scursorassince.network_body- Fetch a request's bodies byrequestId(monitoring must be on): therequestBodyPOST payload and the responsebody. Truncated tomaxBytes(default 65536) withbodyTruncated:truewhilesizereports the full length; returnsbodyErrorif the response body was evicted or is streaming (text/event-streamcan't be read via CDP).evaluate- Execute JavaScript in the page and return the result. Off by default: only available after enabling the "Allow JS execution" toggle in the extension popup or DevTools panel for a connected tab. The grant resets on disconnect.compose- Run a sequence of commands against one tab in a single call. Script is one command per line as<tool>?<query-string>(pluswait?t=<ms>); runs in order, stops on first failure, returns an array of per-command responses.
Note on Selectors: Tools that accept a selector parameter (click, hover, fill, type, insertText, clear, select, keypress, scroll, screenshot, dom) will only operate on the first element that matches the CSS selector. The tool response includes the unique selector of the actual element that was used, which may include an auto-generated ID if the element didn't have one.
XPath Support: All tools that accept a selector parameter also accept an xpath parameter as an alternative. This is particularly useful for:
- Finding elements by text content:
xpath: "//button[contains(text(), 'Submit')]" - Complex element relationships:
xpath: "//div[@class='container']//span[2]" - When CSS selectors are insufficient
Use either selector OR xpath, not both. If both are provided, selector takes precedence.
Keypress Tool
The keypress tool simulates keyboard events. It accepts:
key(required): The key combination to press. Can be:- Single key:
"a","Enter","Tab","Escape"," "(space),"Shift","Control" - With modifiers:
"Control+a","Shift+Tab","Alt+F4","Meta+Shift+p" - Modifier names:
Control(orCtrl),Shift,Alt,Meta(orCmd/Command) - Note: When sending just a modifier key (e.g.,
"Shift"), it's treated as pressing that key alone - Duplicate modifiers are ignored (e.g.,
"Shift+Shift+a"is same as"Shift+a")
- Single key:
selectororxpath(optional): Target a specific element. If not provided, sends to document.body
Examples:
// Press Enter
{ "key": "Enter", "selector": "#login-form" }

// Select all text (Ctrl+A)
{ "key": "Control+a", "selector": "#username" }

// Zoom in (Ctrl+Plus)
{ "key": "Control++", "selector": "body" }

// Zoom out (Ctrl+Minus)
{ "key": "Control+-", "selector": "body" }

// New tab (Ctrl+T)
{ "key": "Control+t" }

// Close tab (Ctrl+W or Cmd+W on Mac)
{ "key": "Meta+w" }
MCP Resources
kapture://tabs- List all connected browser tabskapture://tab/{tabId}- Get detailed information about a specific tabkapture://tab/{tabId}/console- Get console logs from a specific tab (with pagination support)kapture://tab/{tabId}/screenshot- Capture screenshots of a tab or elementkapture://tab/{tabId}/dom- Get HTML content of a tab or elementkapture://tab/{tabId}/elementsFromPoint- Get elements at specific coordinateskapture://tab/{tabId}/elements?selector={selector}&visible={true|false|all}- Query all elements matching a CSS selector or XPath with optional visibility filtering
Development
Server Development
cd server
npm run dev    # Development with hot-reload
Test App
cd test-app
npm run dev    # Run Electron test app
Extension Development
After making changes:
- Go to
chrome://extensions/ - Click refresh on Kapture extension
Key Components
Server (/server/src):
mcp-server-manager.ts- MCP protocol implementation (one server instance per client)browser-websocket-manager.ts- WebSocket server for extension connectionstab-registry.ts- Tab trackingtool-handler.ts+tools.yaml- MCP tool definitions and dispatch
Extension (/extension):
background.js+modules/- Service worker: owns WebSocket connections and executes commands (viachrome.debuggerandchrome.tabsAPIs)page-helpers.js- Content script handling DOM commands (dom,elements,fill,select, ...)modules/background-console.js- Console retrieval via CDP (reads Chrome's per-page console buffer; no extension-side log storage)popup.js- Toolbar popup with connection togglepanel.js- DevTools panel (connection toggle, WebSocket message viewer)
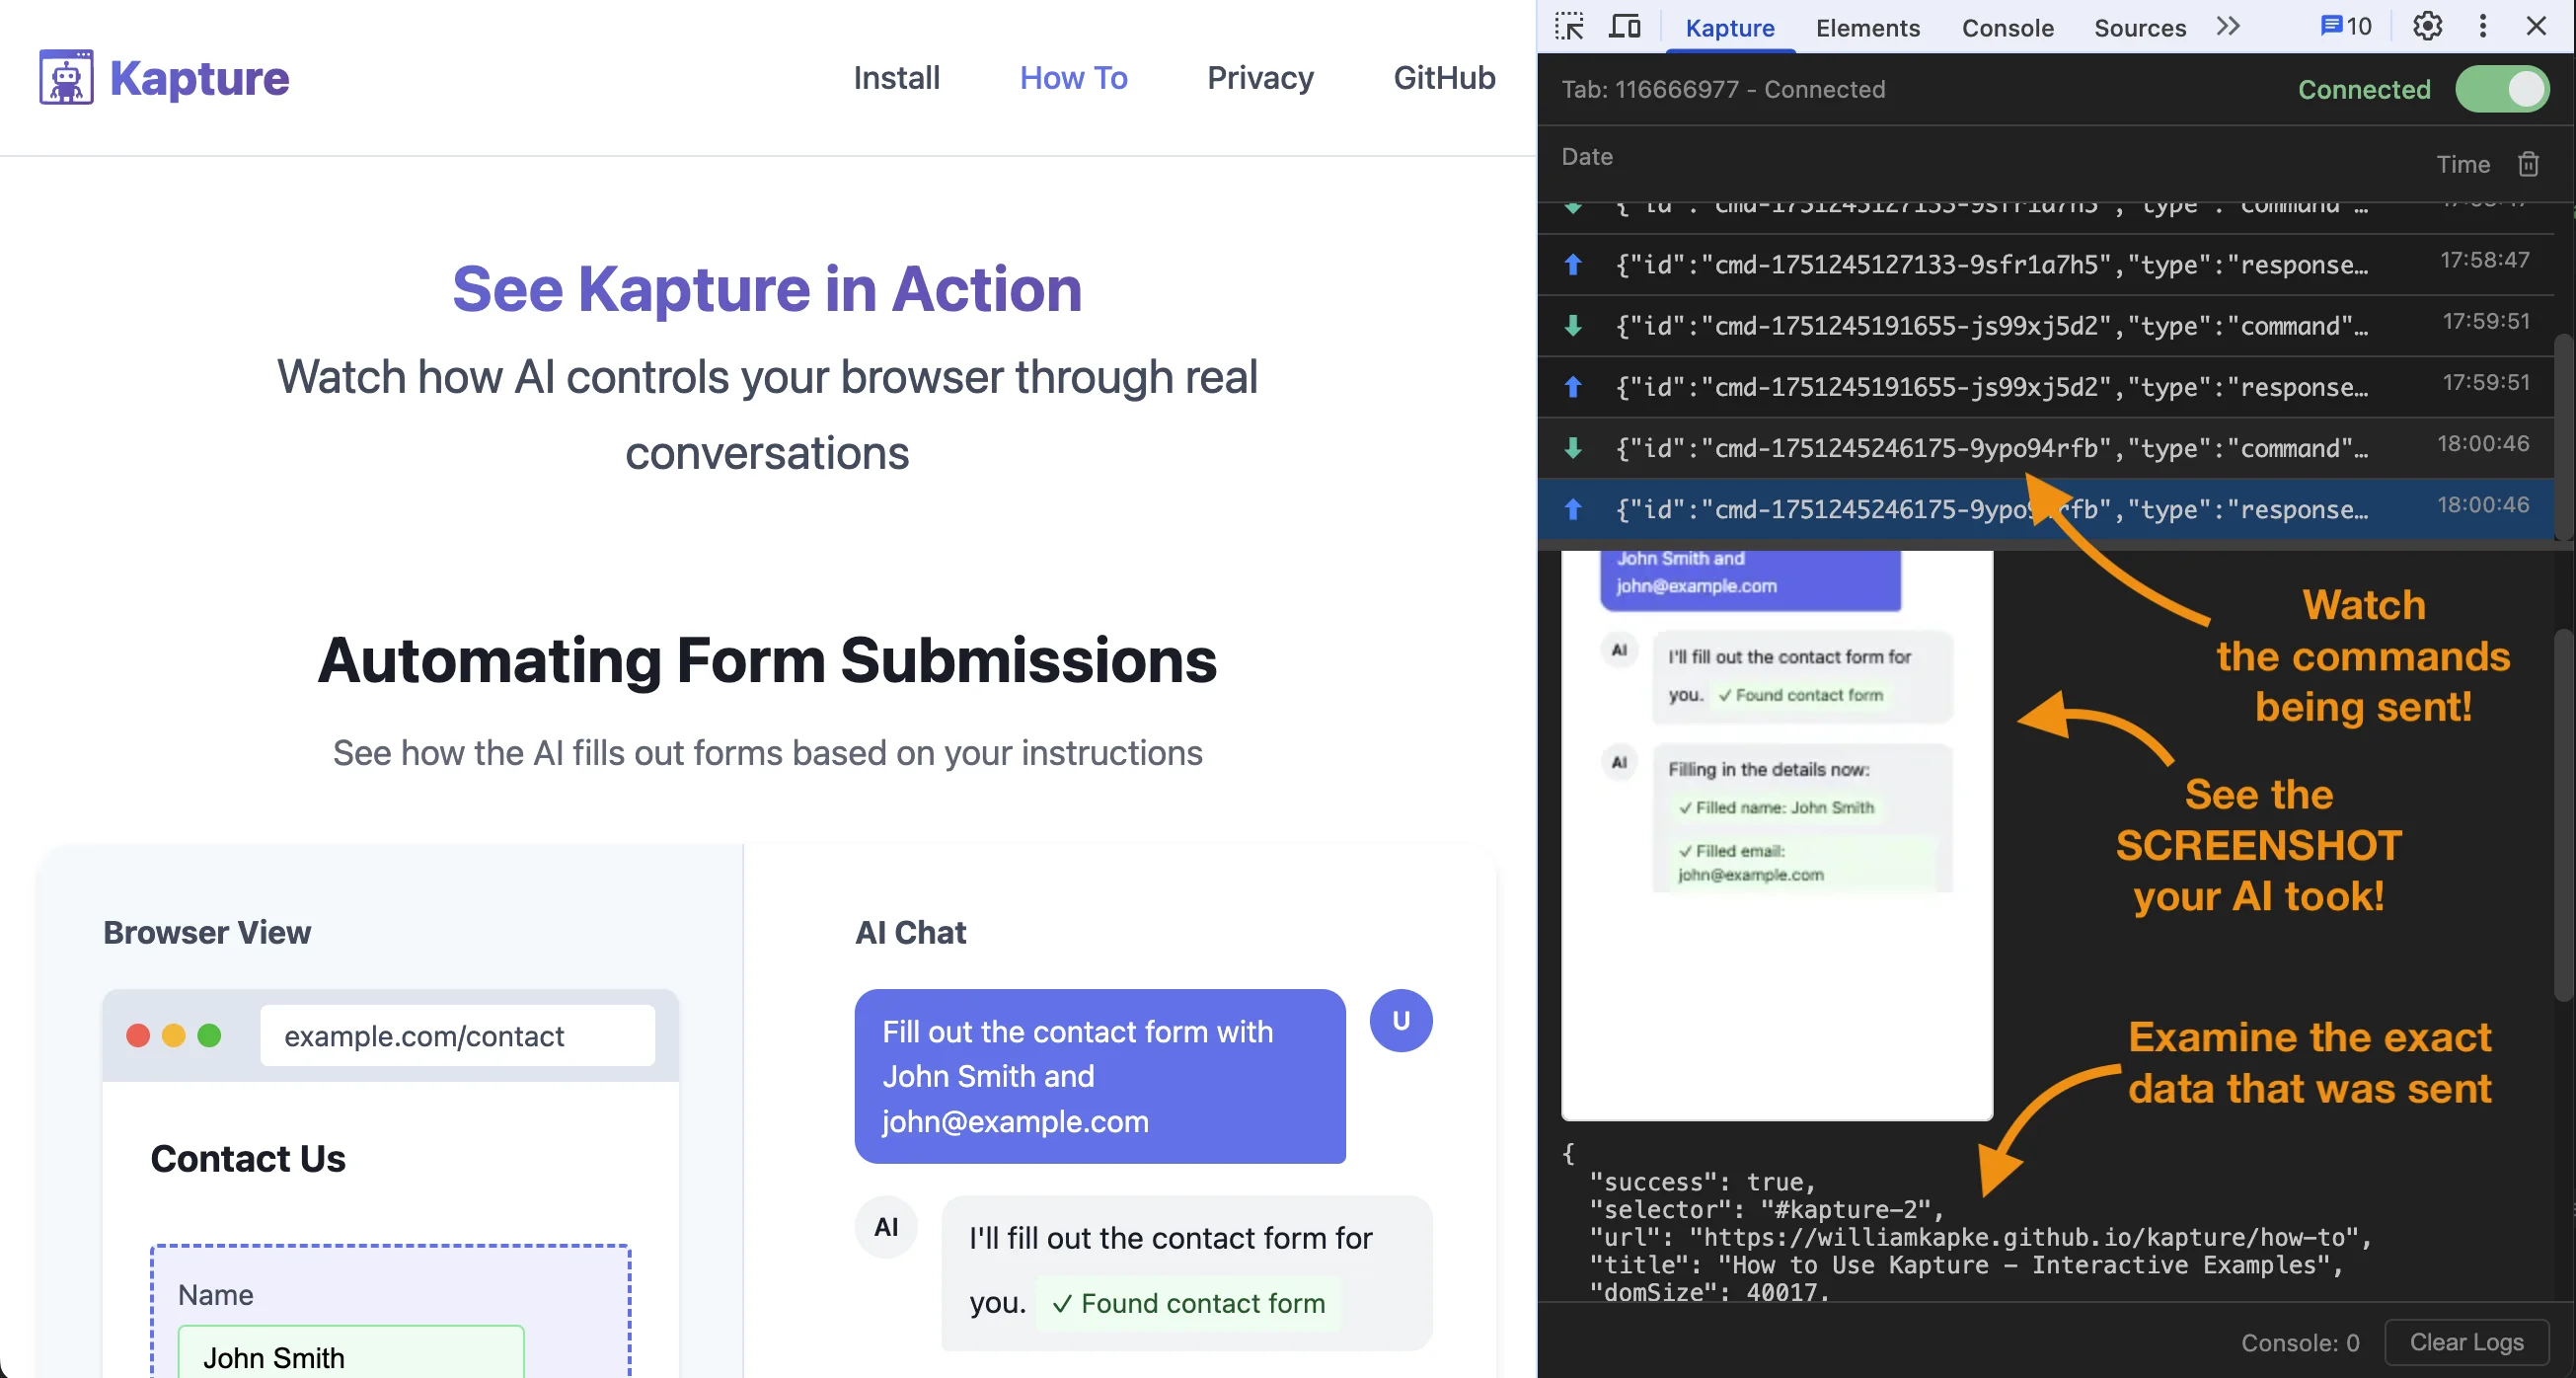
DevTools Panel Features
- Connection Toggle - Connect/disconnect the inspected tab
- Connection Status - Real-time server connection indicator
- Message Viewer - Live view of WebSocket messages between extension and server
- Keepalive Setting - Configurable ping interval
The panel is optional — connections and commands are handled by the background service worker, so automation works with DevTools closed.
Troubleshooting
Connection Issues
- The extension connects to the server on port 61822
- Verify the server is running (
curl http://localhost:61822/) - Check the toolbar icon badge: ✓ = connected, ↻ = retrying
- Check the background service worker console (
chrome://extensions/→ Kapture → service worker) - Check server logs in the terminal
Extension Not Showing
- Ensure extension is loaded and enabled
- Close and reopen DevTools
- Reload extension in
chrome://extensions/
Command Timeouts
- Default timeout is 5 seconds
- Some commands accept custom timeout parameter
- Check element selectors are correct
Security
- DOM commands run in the content script's isolated world; input/navigation/screenshot commands use
chrome.debugger(CDP) - Each tab has unique ID preventing cross-tab interference
- No direct file system access from extension
- Tab registry enforces command isolation
License
MIT