llmprobe
LLM API uç noktalarını test eder ve ilk token süresi, gecikme süresi ve iş hacmi gibi sağlık metriklerini raporlar. Tek modelleri kontrol eder veya yapılandırma tabanlı tam sağlık kontrolleri çalıştırır.
Dokümantasyon

llmprobe
Synthetic monitoring and CI smoke tests for LLM inference endpoints. Measure TTFT, latency, throughput, and errors. Single binary, zero SDKs.
![]()
![]()

llmprobe is a CLI tool for LLM serving reliability. It probes hosted APIs or OpenAI-compatible inference servers, then reports the metrics that matter for production user experience: time to first token (TTFT), total latency, generation throughput (tokens/sec), and error rates.
Use it as a one-off health check, a continuous monitor, or a CI gate that blocks deploys when your LLM provider is degraded.
Public benchmark
llm-bench uses llmprobe to run a continuous public benchmark of major LLM APIs. It publishes a live dashboard at bench.jonathanwrede.de and raw JSONL data in Jwrede/llm-bench-data.
This is the intended use case: repeated synthetic probes that make LLM latency, TTFT regressions, throughput drops, and provider degradation visible before users report them.
Install
Download a prebuilt binary from the latest release (Linux, macOS, Windows; amd64 and arm64).
Or install from source:
go install github.com/Jwrede/llmprobe@latest
llmprobe version
Claude Code plugin
Install as a Claude Code plugin for /llmprobe skill and MCP tools:
claude plugin install Jwrede/llmprobe
Or register the MCP server directly:
claude mcp add --transport stdio llmprobe -- llmprobe mcp
llmprobe runs locally and only contacts LLM endpoints you configure. See PRIVACY.md for details.
Quick start
llmprobe works with OpenAI, Anthropic, Google, Azure OpenAI, AWS Bedrock, and OpenAI-compatible endpoints such as vLLM, Ollama, OpenRouter, Groq, Together AI, Fireworks, DeepSeek, and Mistral.
Create a probes.yml (or copy the included example):
providers:
  - name: openai
    api_key: ${OPENAI_API_KEY}
    models:
      - name: gpt-4o
        thresholds:
          max_ttft: 2s
      - name: gpt-4o-mini
        thresholds:
          max_ttft: 500ms

  - name: anthropic
    api_key: ${ANTHROPIC_API_KEY}
    models:
      - name: claude-sonnet-4-20250514
        thresholds:
          max_ttft: 1s
Run a probe:
$ llmprobe probe

Provider   Model                    Status    TTFT    Latency  Tok/s  Tokens  Error
--------   -----                    ------    ----    -------  -----  ------  -----
openai     gpt-4o                   healthy   312ms   2100ms   68.4   42
openai     gpt-4o-mini              healthy   98ms    814ms    112.3  56
anthropic  claude-sonnet-4-20250514 healthy   420ms   2831ms   52.1   38
azure      gpt-4o                   healthy   289ms   1950ms   71.2   44
bedrock    anthropic.claude-3-5...  degraded  1820ms  4510ms   28.1   38

4 healthy, 1 degraded, 0 errors
What it measures
| Metric | What it means |
|---|---|
| TTFT | Time from request send to first content token. This is what users feel as "lag" before the response starts streaming. |
| Latency | Total time from request to stream close. |
| Tok/s | Generation throughput: tokens produced per second after the first token. Calculated as token_count / (latency - ttft). |
| Tokens | Total output tokens. Prefers provider usage metadata when available, falls back to SSE event counting. |
| Status | healthy if all thresholds pass, degraded if any threshold is exceeded, error if the request failed. |
Commands
llmprobe probe
One-off health check. Probes all configured endpoints and prints results.
llmprobe probe                        # table output
llmprobe probe -f json                # JSON output
llmprobe probe --fail-on degraded     # exit 1 if any endpoint is degraded
llmprobe probe -c custom-config.yml   # custom config path
Exit codes for CI:
--fail-on | Exit 0 | Exit 1 |
|---|---|---|
error (default) | healthy or degraded | any error |
degraded | healthy only | degraded or error |
none | always | never |
llmprobe watch
Continuous monitoring. Probes all endpoints on an interval and prints a summary line per iteration.
llmprobe watch # default 60s interval
llmprobe watch --interval 30s # custom interval
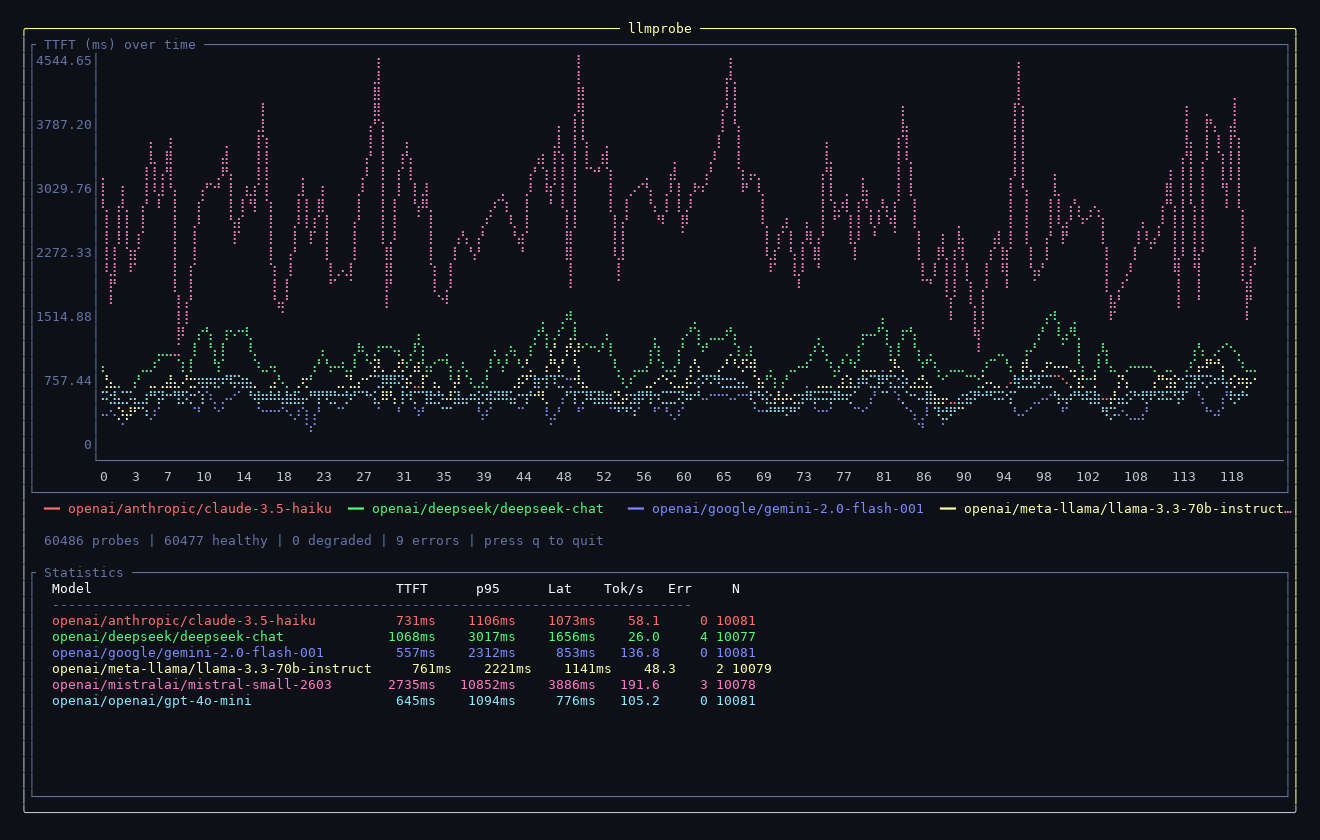
llmprobe watch --tui # live terminal dashboard with TTFT chart
llmprobe watch --tui --load data.jsonl # load historical data into the dashboard
llmprobe watch -f json # JSONL output (one line per result)
llmprobe watch --prometheus :9090 # expose Prometheus metrics
llmprobe watch --otel localhost:4317 # export OpenTelemetry metrics via OTLP/gRPC
The --tui flag launches a live terminal dashboard with a TTFT chart,
color legend, and statistics table. Use --load to import historical
JSONL data (from llmprobe watch -f json > data.jsonl).
$ llmprobe watch --interval 30s

Watching 4 endpoints every 30s (Ctrl+C to stop)

[14:01:02] All 4 endpoints healthy.
[14:01:32] All 4 endpoints healthy.
[14:02:02] 3 healthy, 1 degraded, 0 errors. DEGRADED: openai/gpt-4o (TTFT 1820ms)
[14:02:32] All 4 endpoints healthy.
llmprobe report
Generate a Markdown summary from JSONL probe data with p50/p95/p99 percentiles for TTFT, latency, and throughput per endpoint.
llmprobe report data.jsonl
Output:
| Provider | Model | Probes | Errors | TTFT p50 | TTFT p95 | ... | Tok/s p50 | ...
|----------|-------|--------|--------|----------|----------|-----|-----------|----
| openai   | gpt-4o | 100  | 2      | 115ms    | 188ms    | ... | 46.9      | ...
llmprobe baseline
Create a baseline file from historical JSONL data for regression detection.
llmprobe baseline data.jsonl -o baseline.json
Reference the baseline in your config to use multiplier-based thresholds:
baseline: baseline.json

providers:
  - name: openai
    api_key: ${OPENAI_API_KEY}
    models:
      - name: gpt-4o
        thresholds:
          max_ttft_multiplier: 2.0       # fail if TTFT > 2x baseline p50
          max_latency_multiplier: 2.5    # fail if latency > 2.5x baseline p50
This lets you detect regressions relative to your own historical data rather than setting absolute thresholds.
llmprobe version
Print the installed binary version.
llmprobe version
CI integration
Use llmprobe probe as a pre-deploy gate:
# .github/workflows/deploy.yml
- name: Check LLM providers
  env:
    OPENAI_API_KEY: ${{ secrets.OPENAI_API_KEY }}
    ANTHROPIC_API_KEY: ${{ secrets.ANTHROPIC_API_KEY }}
  run: |
    go install github.com/Jwrede/llmprobe@latest
    llmprobe probe --fail-on degraded
This blocks the deploy if any LLM provider is experiencing degraded performance right now.
When a probe fails, the output shows only the failing endpoints:
Failed endpoints (1/4):
  openai/gpt-4o  DEGRADED  TTFT=280ms  Latency=950ms  Tok/s=32.1
MCP server

llmprobe includes a built-in Model Context Protocol server, allowing Claude Code and other MCP hosts to check LLM API health directly from an agent workflow.
Running the server
llmprobe mcp
This starts the MCP server over stdio.
Registering with Claude Code
claude mcp add --transport stdio llmprobe -- llmprobe mcp
Once registered, Claude Code can call llmprobe tools during any conversation.
Available tools
| Tool | Description |
|---|---|
probe_all | Probe all configured endpoints from probes.yml. Returns TTFT, latency, throughput, and health status for every model. Accepts an optional config parameter for a custom config path. |
probe_model | Probe a single model without a config file. Requires provider, model, and api_key_env. Supports optional base_url for OpenAI-compatible endpoints and optional label for display. |
list_providers | List all providers and models in the config file with their thresholds. Use this to discover available models before probing. |
get_config | Return the full parsed configuration including defaults, providers, models, and thresholds. |
Example use case: An agent calls list_providers to see what models
are configured, then probe_all to verify they are healthy before
deploying changes.
Configuration
defaults:
  prompt: "Hello"                                # probe prompt
  max_tokens: 20                                 # max output tokens
  timeout: 30s                                   # per-probe timeout
  concurrency: 5                                 # max parallel probes

providers:
  - name: openai                    # openai, anthropic, google, azure, bedrock
    label: openai-prod              # optional display name; useful for multiple OpenAI-compatible endpoints
    api_key: ${OPENAI_API_KEY}      # env var expansion
    base_url: https://custom.api    # optional, override endpoint
    models:
      - name: gpt-4o
        prompt: "Say hello."        # override default prompt
        max_tokens: 10              # override default max_tokens
        response_format: json       # optional; OpenAI-compatible JSON mode
        validate_json: true         # optional; mark degraded if returned content is not valid JSON
        thresholds:
          max_ttft: 2s              # alert if TTFT exceeds this
          max_latency: 10s          # alert if total latency exceeds this
          min_tokens_per_sec: 20    # alert if throughput drops below this
          max_ttft_multiplier: 2.0  # optional; compare against baseline p50
          max_latency_multiplier: 2.5

  - name: azure
    api_key: ${AZURE_OPENAI_API_KEY}
    base_url: https://your-resource.openai.azure.com
    api_version: "2024-10-21"       # optional, defaults to 2024-10-21
    models:
      - name: gpt-4o               # deployment name

  - name: bedrock
    access_key: ${AWS_ACCESS_KEY_ID}
    secret_key: ${AWS_SECRET_ACCESS_KEY}
    region: us-east-1
    models:
      - name: anthropic.claude-3-5-sonnet-20241022-v2:0
API keys and AWS credentials support ${ENV_VAR} syntax. Only credential
fields are expanded, so env var references in prompts or model names are
left as-is.
OpenAI-compatible providers
Many providers (Groq, Together AI, Fireworks, DeepSeek, Mistral, OpenRouter,
Ollama, vLLM) expose an OpenAI-compatible API. These work out of the box
by setting base_url. Use the label field to distinguish multiple
OpenAI-compatible blocks:
providers:
  # Groq
  - name: openai
    label: groq
    api_key: ${GROQ_API_KEY}
    base_url: https://api.groq.com/openai
    models:
      - name: llama-3.3-70b-versatile

  # DeepSeek
  - name: openai
    label: deepseek
    api_key: ${DEEPSEEK_API_KEY}
    base_url: https://api.deepseek.com
    models:
      - name: deepseek-chat

  # Together AI
  - name: openai
    label: together
    api_key: ${TOGETHER_API_KEY}
    base_url: https://api.together.xyz
    models:
      - name: meta-llama/Meta-Llama-3.1-70B-Instruct-Turbo

  # Local Ollama
  - name: openai
    label: ollama
    api_key: unused
    base_url: http://localhost:11434
    models:
      - name: llama3.2
See examples/ for ready-to-use configs for vLLM, SGLang, and Ollama.
JSON response validation
For OpenAI-compatible endpoints, set response_format: json to request JSON
mode and validate_json: true to mark the probe as degraded if the streamed
content is not valid JSON.
providers:
  - name: openai
    label: vllm-json
    api_key: unused
    base_url: http://localhost:8000
    models:
      - name: meta-llama/Llama-3.1-8B-Instruct
        prompt: 'Return {"ok": true} as JSON.'
        response_format: json
        validate_json: true
Prometheus metrics
Run with --prometheus to expose metrics for scraping:
llmprobe watch --interval 30s --prometheus :9090
Available metrics at /metrics:
| Metric | Type | Labels |
|---|---|---|
llmprobe_ttft_seconds | gauge | provider, model |
llmprobe_latency_seconds | gauge | provider, model |
llmprobe_tokens_per_second | gauge | provider, model |
llmprobe_token_count | gauge | provider, model |
llmprobe_status | gauge | provider, model |
llmprobe_probes_total | counter | provider, model |
llmprobe_errors_total | counter | provider, model |
llmprobe_ttft_seconds_hist | histogram | provider, model |
llmprobe_latency_seconds_hist | histogram | provider, model |
llmprobe_tokens_per_second_hist | histogram | provider, model |
The llmprobe_status gauge encodes health as: 1 = healthy, 0.5 = degraded,
0 = error. Use this for alerting in Grafana or Alertmanager.
OpenTelemetry metrics
Run with --otel to export probe metrics to an OTLP/gRPC collector.
llmprobe watch --interval 30s --otel localhost:4317
Exported metric names:
| Metric | Description |
|---|---|
llmprobe.ttft.seconds | Time to first token in seconds |
llmprobe.latency.seconds | Total request latency in seconds |
llmprobe.tokens_per_second | Generation throughput |
llmprobe.token_count | Output token count from the last probe |
llmprobe.status | 1 = healthy, 0.5 = degraded, 0 = error |
llmprobe.probes.total | Total probes executed |
llmprobe.errors.total | Total probe errors |
All metrics include provider and model attributes.
Architecture
probes.yml
  -> Config loader (YAML + env var expansion)
    -> Probe engine (concurrent goroutines per provider/model)
      -> Provider clients (raw HTTP + SSE parsing, no SDKs)
        -> Results (TTFT, latency, tokens/sec, status)
          -> Output (table, JSON, JSONL)
Each provider client is a thin HTTP wrapper that sends a streaming request and parses the response. No LLM SDKs are imported. The SSE parser handles both data-only events (OpenAI, Google) and named events (Anthropic). The Bedrock client implements SigV4 signing and AWS binary event stream parsing from scratch.
TTFT is measured from the moment the HTTP request is sent to the first event that contains actual content text (not role assignments or metadata).
Providers
| Provider | Endpoint | Auth | Streaming format |
|---|---|---|---|
| OpenAI | /v1/chat/completions | Authorization: Bearer | SSE, [DONE] sentinel |
| Anthropic | /v1/messages | x-api-key header | named-event SSE |
/v1beta/models/{model}:streamGenerateContent?alt=sse | key query param | SSE | |
| Azure OpenAI | /openai/deployments/{model}/chat/completions | api-key header | SSE, [DONE] sentinel |
| AWS Bedrock | /model/{model}/converse-stream | SigV4 | AWS binary event stream |
| OpenAI-compat | /v1/chat/completions (custom base_url) | Authorization: Bearer | SSE |
OpenAI-compatible covers: Groq, Together AI, Fireworks, DeepSeek, Mistral, OpenRouter, Ollama, vLLM, and any endpoint that speaks the OpenAI chat completions API.
Roadmap
- More provider-specific examples for self-hosted OpenAI-compatible endpoints
- More report formats for long-running monitoring windows
- Optional runbook templates for common LLM endpoint failures
License
MIT