SciDrawer AI
SciDrawer is an AI-powered scientific diagram maker for researchers. It transforms research questions, sketches, and reference figures into clear, publication-ready visuals, including mechanism pathways, graphical abstracts, laboratory layouts, and microscopic structures.
Documentation
Scientific Diagram Maker for Research Figures & Graphical Abstracts
Create research visuals for papers, preprints, and conferences. Describe a mechanism, upload a sketch, or add a reference figure; SciDrawer turns the brief into a clear, journal-ready pathway diagram, mechanism map, experimental layout, microscopic structure, or graphical abstract. Refine the prompt, review the details, and download a high-resolution image for your manuscript, slides, or poster.
Start with your research question — no drawing skills required.
A scientific diagram maker for every figure your paper needs
One workspace for the figure formats researchers return to most: journal mechanisms, graphical abstracts, reference-matched panels, high-resolution exports, and conference posters.
Text to scientific diagram
Describe a molecular pathway, protocol, or result in one sentence. Get a labelled, publication-grade mechanism panel or graphical abstract with legible text, clear arrow directions, and a layout that reads at column width.
Sketch to precise diagram
Photograph the whiteboard or a napkin sketch. The scientific diagram maker redraws it with clean geometry, aligned labels, and consistent line weights so the figure reads at arm's length.
Reference figure to matching style
Upload a figure you admire and generate new panels with a matching palette, type weight, and label style, so a multi-figure manuscript reads as one coherent visual system.
High-resolution image output
Choose the resolution and quality for each generation, then use reference images to guide the composition, palette, and visual style. Export at 1K, 2K, or 4K for posters, papers, and print.
Template library, 9 categories
Mechanism pathways, lab equipment, microscopic structures, graphical abstracts, and five more categories — start any figure from a tested layout instead of a blank canvas. A scientific diagram maker is only as useful as the templates it ships with.
Conference poster layouts
Start with a finished manuscript or PDF and create a print-ready A0 poster that reuses your figures with a consistent palette, typography, and visual hierarchy.
From idea to figure in three steps
No drawing skills or complex setup required.
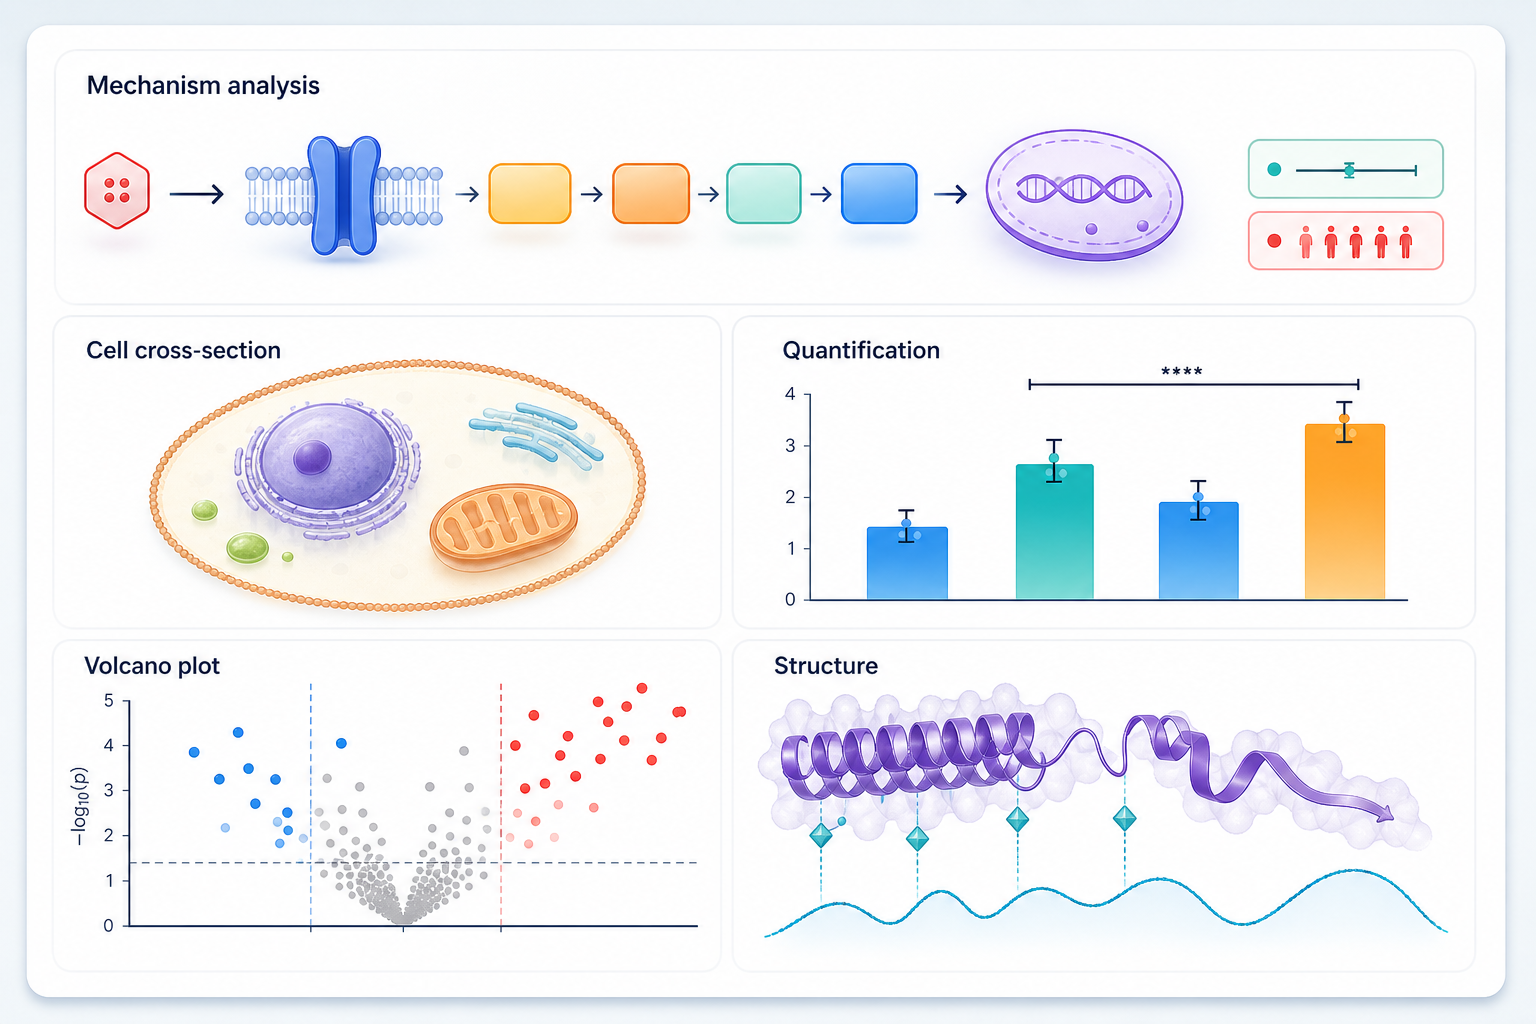
Research-figure guide
Plan a scientific diagram readers can understand at a glance
A strong research figure does more than decorate results. It lets readers understand the question, evidence, and conclusion before they reach the methods. Use this scientific diagram maker to turn a concise brief into a visual starting point, then review every claim against your data.
01
Begin with the claim, not the decoration
Write one sentence stating the biological, clinical, or technical question; name the entities, direction of change, and evidence the image must show. For a mechanism pathway, include the trigger, intermediate steps, and outcome. For a plant cell labeled diagram, list the structures that need labels and the learning goal. A focused brief produces fewer ambiguous arrows and less revision.
02
Choose a visual structure for the reader
Use a left-to-right sequence for a workflow, a concentric layout for a cell, or panels for a graphical abstract. Keep labels short, distinguish observation from hypothesis, and reserve colour for categories that matter. Reference images can preserve a lab's visual language, but each new figure should explain its own result without requiring readers to decode another paper.
03
Review before the figure reaches the manuscript
Check that every arrow, scale, label, and image element is scientifically accurate and consistent with the legend. Then export the required resolution and confirm the journal's specifications for image files, fonts, accessibility, and permissions. The scientific diagram maker accelerates visual drafting; authors retain responsibility for scientific interpretation and final submission.
Figure atlas
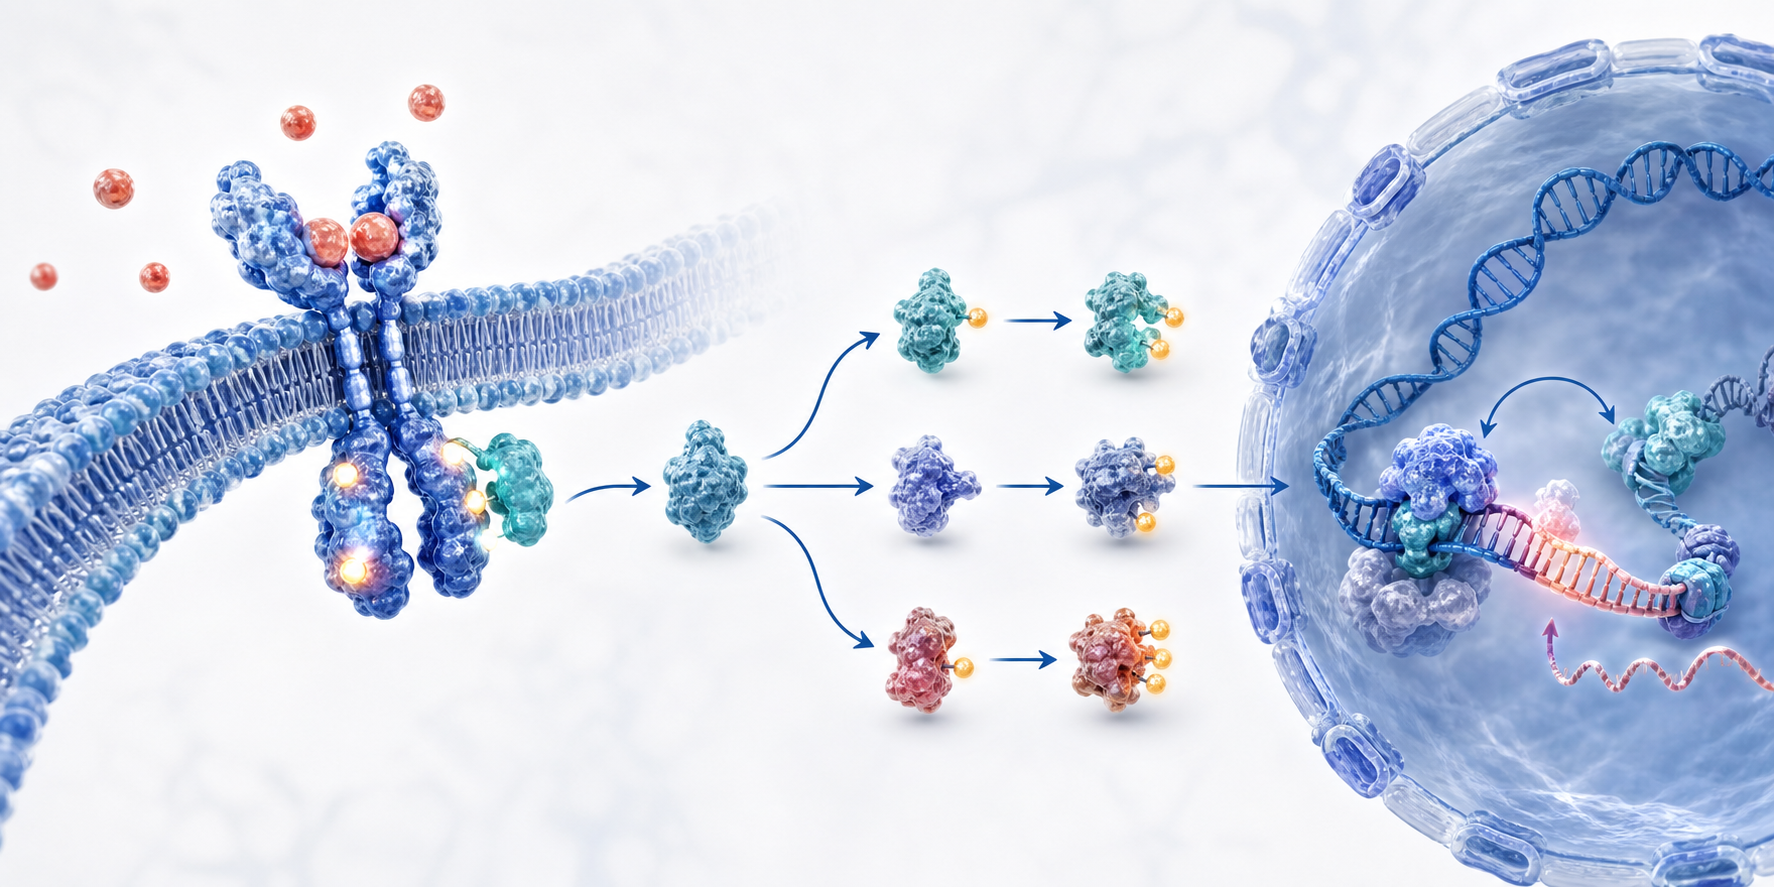
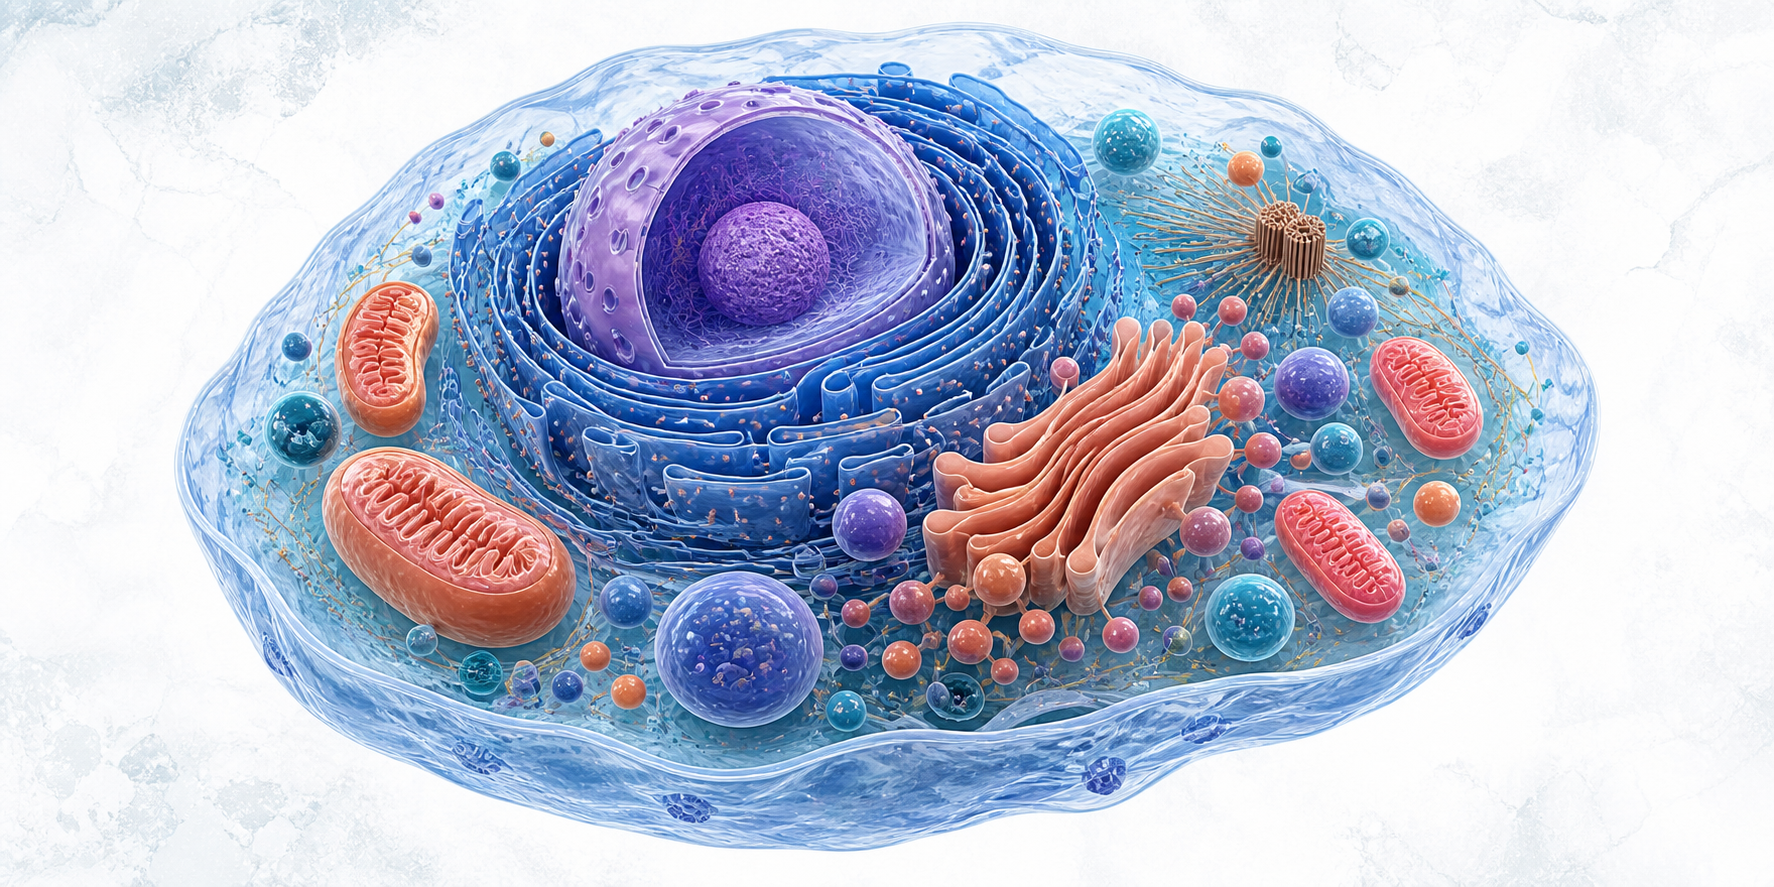
From a research question to a figure that explains it
Browse publication-style examples by the story your research needs to tell. Adapt each starting prompt and regenerate it for your manuscript.


Pricing
Every plan includes the full template library and bilingual output. Cancel any time.
Starter
/mo
For a single manuscript
- 612 render credits per month
- 17 credits = one balanced 1K render
- Full 9-category template library
- English and Chinese labelling
Most popular
Pro
/mo
For researchers publishing regularly
- 1,564 render credits per month
- 17 credits = one balanced 1K render
- Full 9-category template library
- Sketch and reference-image conversion
- Reference images (+3 credits each, up to 16)
- Priority generation queue
Lab
/mo
For labs and co-authors
- 3,264 render credits per month
- 17 credits = one balanced 1K render
- Full 9-category template library
- Sketch and reference-image conversion
- Reference images (+3 credits each, up to 16)
- Batch generation (up to 10 per request)
- Mask-based inpainting editing
- Shared team workspace
- Priority support
Frequently asked questions
What researchers ask before their first submission.
Can I submit these figures to a journal?
What makes SciDrawer a good scientific diagram maker?
What is a graphical abstract maker?
How can I use generated figures?
Can it really turn a hand-drawn sketch into a proper figure?
Can I match the style of a figure from another paper?
Will it invent scientific details that weren't in my prompt?
Can I edit or re-style the figure after it's generated?
Who owns the figures? Can I publish them commercially?
Your next figure shouldn't take an afternoon
Start with a sentence. Get a submission-ready figure back before your coffee goes cold.
Turn your findings into a publication-ready graphical abstract with our AI diagram maker.