Antevo Tremor Watch
매주 753개 시장 관계 중 과거의 흐름에서 벗어난 관계는 가족 및 쌍별로 각각 몇 개일까요? 1997년부터의 Antevo Tremor Index. 계정이 필요하지 않습니다.
호스팅형 MCP 서버
npx add-mcp 'https://api.antevo.ch/mcp/tremor/mcp'Claude Code, Codex, Cursor 등에 설치됩니다
문서
Antevo · Tremor Watch The week ending Friday 13 November 2026 · published every Saturday · Permalink · JSON · Archive · Instruments
669 relationships, 87 stopped behaving.
First reading, provisional: 84 pairs have no reading yet and are filled in next Saturday, so these figures can still move.
Out of 1,350 Fridays since 2001, this is the 118th most unsettled.
Every week we check how 669 pairs of markets stand to each other. This week the breaks gather in volatility and equity regions: 41 of 176 pairs, where a normal Friday has 9. Bonds have not joined in.
a normal Friday 1×
last week 3.7×
Oct 2008 · 14×
worst on record · Feb 2020 · 21×
this week 4.0×
Height
4.0×
a normal Friday. High: weeks this high come 9 in 100. Feb 2020 peaked at 21×, Oct 2008 at 14×.
Breadth
2 of 7 families hot: volatility and equity regions. A family is hot when three times as many of its pairs break as on a normal Friday.
Direction
week 5
Rising, 3.7× → 4.0×, fifth week above the Elevated line (2.1×). Last time it stood here on the way up: May 2026.
Reach into bonds
Not yet.
19 of 112 bond pairs breaking, where a normal Friday has 8. Credit: 7 of 112, normal 6.
Three ways to watch the ground move.
Regime reads US shares. Dislocation reads the relationships between markets.
Regimehow much fear is priced into US shares, and how many take part?New
this week 14 Aug calm · broad fear · broad calm · narrow fear · narrow ← calm · fear priced in → ← narrow · participation · broad →
Fear and participation · US shares, every Friday since 2010
Fear is normal. Participation has been narrow since 16 Oct.
When before: fear above normal and participation narrow at once
- This week not one of them
- Apr 2025 6 weeks
- Mar 2023 2 weeks
- Apr 2022 37 weeks
- Mar 2022 2 weeks
13 such runs since 2010, the latest four shown · a run ends after three Fridays without
Dislocationare the relationships holding?
[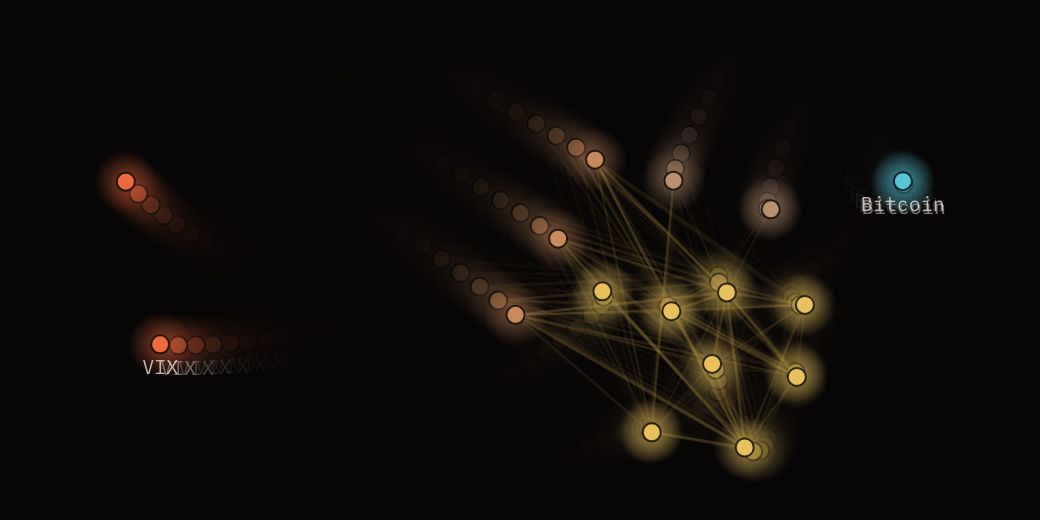
The correlation field: twenty markets as points, drawn together by the pull between them
Correlation fieldThe market moving as one. Play the 2020 crash week by week and watch diversification fade as the field contracts to a single knot.Drill down ↗](https://antevo.ch/tremor-watch/instruments/#field) surface · breaking this week the deep · holding Nikkei 225 ⟋ Sensex Sensex ⟋ TAIEX Hang Seng ⟋ TAIEX Surfacing radar LiveThe full radar sets the horizon and replays 2008, 2020 and 2025.Drill down ↗
Every instrument on one page, with the vol canary, an illustration of 2007–08.
Where, which, and when before.
The week in full, as published every Saturday: every family, every pair that stopped behaving, the episodes it compares with, and US shares.
Volatility
16 of 56 · normal 3
Equity regions
25 of 120 · normal 6
Bonds
19 of 112 · normal 8
Commodities
8 of 112 · normal 6
FX and crypto
9 of 112 · normal 7
Credit
7 of 112 · normal 6
US sectors
3 of 45 · normal 3
holdscame apartmoved closer Explore this week on the radar.
Ten relationships that stopped behaving.
The ones you can name, ranked by how unusual. Of the 87, 37 are new this week; 50 were breaking last week too. A pair stays listed while it is more than two standard deviations from its own past.
- 01 Nikkei 225 ⟋ Sensex Usually move together; now they move against each other. also last week · came apart · correlation −0.45 · z −4.0
- 02 Sensex ⟋ TAIEX Usually move together; now they move against each other. also last week · came apart · correlation −0.56 · z −3.9
- 03 Hang Seng ⟋ TAIEX Usually move together; now they move against each other. also last week · came apart · correlation −0.48 · z −3.7
- 04 Mexico IPC ⟋ VIX (equity vol) Usually a hedge for each other; now they move together. also last week · came apart · correlation 0.24 · z −3.6
- 05 Sensex ⟋ VIX (equity vol) Usually a hedge for each other; now they move together. also last week · came apart · correlation 0.36 · z −3.5
- 06 US Tech ⟋ MOVE (bond vol) Usually a hedge for each other; now they move together. also last week · came apart · correlation 0.03 · z −3.3
- 07 TAIEX ⟋ US 10y Treasury Usually move together; now they move against each other. since 30 Oct · came apart · correlation −0.44 · z −3.3
- 08 Nikkei 225 ⟋ Mexico IPC Usually move together; now they move against each other. also last week · came apart · correlation −0.37 · z −3.3
- 09 Nikkei 225 ⟋ Hang Seng Usually move together; now they move against each other. also last week · came apart · correlation −0.43 · z −3.2
- 10 KOSPI ⟋ Sensex Usually move together; now they move against each other. also last week · came apart · correlation −0.47 · z −3.2
Left the list since last Friday: FTSE 100 ⟋ Jakarta (z −2.9 → −2.0) · FTSE 100 ⟋ VIX (equity vol) (z −2.8 → −1.8) · US Financials ⟋ VIX (equity vol) (z −2.7 → −2.0) · and 23 more
Ten are listed above. The other 77 are marks in the field; the table holds all 87.
| Family | Pair | Direction | Correlation | z |
|---|---|---|---|---|
| Equity regions | Nikkei 225 ⟋ Sensex | came apart | −0.45 | −4.0 |
| Equity regions | Sensex ⟋ TAIEX | came apart | −0.56 | −3.9 |
| Equity regions | Hang Seng ⟋ TAIEX | came apart | −0.48 | −3.7 |
| Volatility | Mexico IPC ⟋ VIX (equity vol) | came apart | 0.24 | −3.6 |
| Volatility | Sensex ⟋ VIX (equity vol) | came apart | 0.36 | −3.5 |
| Volatility | US Tech ⟋ MOVE (bond vol) | came apart | 0.03 | −3.3 |
| Bonds | TAIEX ⟋ US 10y Treasury | came apart | −0.44 | −3.3 |
| Equity regions | Nikkei 225 ⟋ Mexico IPC | came apart | −0.37 | −3.3 |
| Equity regions | Nikkei 225 ⟋ Hang Seng | came apart | −0.43 | −3.2 |
| Equity regions | KOSPI ⟋ Sensex | came apart | −0.47 | −3.2 |
| Equity regions | S&P 500 ⟋ Sensex | came apart | −0.28 | −3.2 |
| Volatility | TAIEX — VIX (equity vol) | moved closer | −0.77 | +3.2 |
| US sectors | US Tech ⟋ US Discretionary | came apart | 0.16 | −3.2 |
| Bonds | TAIEX ⟋ TIPS (TIP) | came apart | −0.41 | −3.2 |
| Volatility | Hang Seng ⟋ VIX (equity vol) | came apart | 0.33 | −3.1 |
| Bonds | TAIEX ⟋ Intl bonds (BNDX) | came apart | −0.45 | −3.1 |
| Equity regions | S&P 500 ⟋ Mexico IPC | came apart | −0.13 | −3.1 |
| Commodities | Hang Seng — Gold | moved closer | 0.62 | +3.0 |
| Bonds | US Tech ⟋ EM bonds (EMB) | came apart | −0.12 | −3.0 |
| Commodities | Tadawul ⟋ Natural gas | came apart | 0.52 | −2.8 |
| Bonds | S&P 500 ⟋ EM bonds (EMB) | came apart | 0.11 | −2.8 |
| FX and crypto | Nikkei 225 ⟋ Swiss franc vs USD | came apart | −0.49 | −2.8 |
| Equity regions | Hang Seng ⟋ KOSPI | came apart | −0.38 | −2.8 |
| FX and crypto | Euro Stoxx 50 ⟋ Bitcoin | came apart | −0.30 | −2.8 |
| Equity regions | S&P 500 ⟋ Hang Seng | came apart | −0.23 | −2.7 |
| Bonds | World (ACWI) ⟋ EM bonds (EMB) | came apart | 0.16 | −2.7 |
| FX and crypto | US Financials ⟋ Bitcoin | came apart | −0.37 | −2.7 |
| Volatility | World (ACWI) ⟋ MOVE (bond vol) | came apart | −0.19 | −2.7 |
| Volatility | S&P 500 ⟋ MOVE (bond vol) | came apart | −0.16 | −2.7 |
| Bonds | US Industrials ⟋ EM bonds (EMB) | came apart | 0.03 | −2.6 |
| Volatility | US Discretionary ⟋ VIX (equity vol) | came apart | −0.36 | −2.6 |
| Bonds | TAIEX ⟋ EM bonds (EMB) | came apart | −0.17 | −2.6 |
| Equity regions | KOSPI ⟋ Mexico IPC | came apart | −0.49 | −2.6 |
| FX and crypto | US Industrials ⟋ Swiss franc vs USD | came apart | −0.45 | −2.5 |
| FX and crypto | US Utilities ⟋ Bitcoin | came apart | −0.49 | −2.5 |
| Equity regions | TAIEX ⟋ Mexico IPC | came apart | −0.34 | −2.5 |
| US sectors | US Industrials ⟋ US Real estate | came apart | 0.17 | −2.5 |
| Equity regions | S&P 500 — TAIEX | moved closer | 0.77 | +2.5 |
| Bonds | Jakarta ⟋ TIPS (TIP) | came apart | −0.38 | −2.5 |
| FX and crypto | US Industrials ⟋ Bitcoin | came apart | −0.41 | −2.5 |
| Credit | Mexico IPC ⟋ US HY credit | came apart | −0.26 | −2.5 |
| Commodities | Sensex ⟋ Copper | came apart | −0.24 | −2.4 |
| US sectors | US Tech ⟋ US Real estate | came apart | −0.39 | −2.4 |
| Bonds | Nikkei 225 ⟋ EM bonds (EMB) | came apart | −0.16 | −2.4 |
| Credit | Jakarta — US HY credit | moved closer | 0.56 | +2.4 |
| Bonds | Euro Stoxx 50 ⟋ TIPS (TIP) | came apart | −0.38 | −2.4 |
| Equity regions | ASX 200 ⟋ TAIEX | came apart | −0.05 | −2.4 |
| Credit | Tadawul — Euro HY credit | moved closer | 0.63 | +2.4 |
| Credit | US Tech ⟋ US IG credit | came apart | 0.20 | −2.3 |
| Equity regions | SMI ⟋ Jakarta | came apart | −0.23 | −2.3 |
| Bonds | KOSPI ⟋ TIPS (TIP) | came apart | −0.36 | −2.3 |
| Bonds | EM (EEM) ⟋ EM bonds (EMB) | came apart | 0.07 | −2.3 |
| Volatility | EM (EEM) ⟋ MOVE (bond vol) | came apart | −0.13 | −2.3 |
| Volatility | US Industrials ⟋ MOVE (bond vol) | came apart | −0.12 | −2.3 |
| Equity regions | KOSPI ⟋ ASX 200 | came apart | −0.22 | −2.3 |
| Volatility | TAIEX ⟋ MOVE (bond vol) | came apart | 0.12 | −2.2 |
| Equity regions | Hang Seng — Sensex | moved closer | 0.62 | +2.2 |
| Credit | Tadawul — US HY credit | moved closer | 0.59 | +2.2 |
| Volatility | KOSPI ⟋ MOVE (bond vol) | came apart | 0.07 | −2.2 |
| Credit | US Tech ⟋ Euro HY credit | came apart | 0.01 | −2.2 |
| Volatility | Nikkei 225 ⟋ MOVE (bond vol) | came apart | 0.06 | −2.2 |
| Bonds | Hang Seng ⟋ Intl bonds (BNDX) | came apart | 0.38 | −2.2 |
| Equity regions | Nikkei 225 ⟋ ASX 200 | came apart | 0.03 | −2.2 |
| Volatility | TSX ⟋ VIX (equity vol) | came apart | −0.19 | −2.2 |
| Bonds | Bovespa ⟋ EM bonds (EMB) | came apart | −0.13 | −2.2 |
| Bonds | Tadawul ⟋ TIPS (TIP) | came apart | −0.36 | −2.2 |
| Equity regions | S&P 500 ⟋ ASX 200 | came apart | 0.23 | −2.2 |
| Equity regions | SMI ⟋ Bovespa | came apart | −0.25 | −2.2 |
| Credit | Hang Seng ⟋ EM corporate credit | came apart | 0.04 | −2.2 |
| Volatility | ASX 200 ⟋ VIX (equity vol) | came apart | −0.15 | −2.2 |
| Equity regions | Hang Seng ⟋ Jakarta | came apart | −0.10 | −2.2 |
| Commodities | SMI ⟋ Silver | came apart | −0.07 | −2.1 |
| FX and crypto | US Tech ⟋ Swiss franc vs USD | came apart | −0.38 | −2.1 |
| Commodities | US Utilities ⟋ Silver | came apart | −0.26 | −2.1 |
| FX and crypto | US Discretionary ⟋ Bitcoin | came apart | −0.03 | −2.1 |
| Bonds | KOSPI ⟋ EM bonds (EMB) | came apart | −0.18 | −2.1 |
| Commodities | Sensex ⟋ Natural gas | came apart | 0.20 | −2.1 |
| Equity regions | Euro Stoxx 50 ⟋ Hang Seng | came apart | −0.02 | −2.1 |
| Equity regions | Euro Stoxx 50 ⟋ Mexico IPC | came apart | 0.09 | −2.1 |
| Commodities | Euro Stoxx 50 ⟋ Copper | came apart | 0.15 | −2.1 |
| Bonds | Nikkei 225 ⟋ TIPS (TIP) | came apart | −0.40 | −2.1 |
| FX and crypto | Nikkei 225 ⟋ Euro vs USD | came apart | −0.29 | −2.1 |
| Volatility | US Real estate ⟋ VIX (equity vol) | came apart | 0.17 | −2.1 |
| Equity regions | S&P 500 ⟋ TSX | came apart | 0.39 | −2.1 |
| Commodities | US Energy — Gold | moved closer | −0.48 | +2.0 |
| Bonds | KOSPI ⟋ US 10y Treasury | came apart | −0.43 | −2.0 |
| Equity regions | Bovespa ⟋ Mexico IPC | came apart | 0.15 | −2.0 |
Three times before. Friday by Friday, from the week each one crossed.
One square a Friday, fourteen Fridays from the week the index crossed the Elevated line. Colour is height. The two worst on record and the most recent.
Episode
124568101214
What followed
Now Oct 2026 · week 5, open
4.0× in week 5, high. Two families hot, bonds not yet. Next week fills the dashed square.
2020 from Feb 2020 · 20 weeks
Peaked at 21× in week 4, the worst on record. Back under the Elevated line after 20 weeks. Replay it in the field · on the radar.
2008 from Aug 2008 · 23 weeks
Peaked at 14× in week 10. Back under the Elevated line after 23 weeks. Replay it on the radar.
Apr 2026 from Feb 2026 · 18 weeks
Peaked at 4.7× in week 10. Back under the Elevated line after 18 weeks.
calmelevatedhighseverenext Friday
A second reading, beside the index and not part of it.
Fear priced in
Normal.
More than in 79 of 100 Fridays since 2010. Last week: normal.
Participation
Narrow.
Fewer shares taking part than in 81 of 100 Fridays since 2010. Last week: narrow.
Both at once
13 in 100
Fridays since 2010 with fear above normal and participation narrow. Last time: 9 May 2025.
Beside the index
Apart.
The Tremor index stands at 4.0× a normal Friday, High. Relationships are breaking while fear is not priced in.
The last 14 Fridays
Fear priced in
Participation
14 Aug13 Nov
low fear · broadnormalfear above normal · narrowhigh fear · very narrow
Fear: realised volatility of US shares and credit spreads. Participation: the share of US stocks above their 200-day average, advances against declines, and the index within its own year’s range. Each is measured against its own past. Derived statistics only, no prices. Descriptive, not a forecast.
The same colour.
What moved in seven days, and what didn't.
Severity, against a normal Friday
3.7× → 4.0×
Pairs behaving unlike their past
76 → 87
Families hot
2 of 7 → 2 of 7
New on the list
37 pairs · TAIEX ⟋ TIPS (TIP) among them
US shares: fear and participation
normal, narrow → normal, narrow
Reach into bonds
9 of 112 → 19 of 112 · not yet
Is the ground moving? Tremor Watch in a minute and a half. A seismograph can’t tell you when the next earthquake will come; it tells you whether the ground is moving. Tremor Watch does that for markets, whose ground is their relationships: every week it counts the ones that stopped behaving like their own past two years, with a reading for every week since 1997. 1 min 26 s · in English, with captions · The pictures are illustrations; the index since 1997 is the real reading · Descriptive, not a forecast.
Is the ground moving? Tremor Watch in a minute and a half.
A seismograph can’t tell you when the next earthquake will come; it tells you whether the ground is moving. Tremor Watch does that for markets, whose ground is their relationships: every week it counts the ones that stopped behaving like their own past two years, with a reading for every week since 1997.
1 min 26 s · in English, with captions · The pictures are illustrations; the index since 1997 is the real reading · Descriptive, not a forecast.
The next square is written on Saturday 21 November 2026.Every Saturday morning, for the week that ended on Friday.
753 pairs in seven families, each family weighing the same · correlation of weekly returns, weighted to the last few months (half-life nine weeks), Friday to Friday · a pair breaks when that correlation is two standard deviations away from its own previous two years (Fisher z, spread floored at sampling noise) · Calm, Elevated, High and Severe are the 75th, 90th and 97th percentiles of every week since 2001 · a normal Friday is the median week since 2001 · derived statistics only, no prices · since 1997, recomputed each week, the first published value kept.