Financial Tech Wiz Trading Journal
Importa automáticamente operaciones de más de 25 brókers y analiza el rendimiento con tasa de acierto, factor de beneficio, curva de capital, análisis de drawdown, comparativas con el S&P 500 y un AI Trading Coach.
Documentación
The Trading Journal That Scans the Market for You
Your trades log themselves fromand 25+ brokerswith Broker Auto Sync Paid
Sign up free with your email. Import your trades, review each one on a chart, and see prebuilt swing trading scanners. Upgrade for Broker Auto Sync, today's live and preliminary scan results and the AI Trading Coach.
Free journal, no card needed. Paid plans are $19/month or $119/year, and annual is $79 for the first year through November 30.
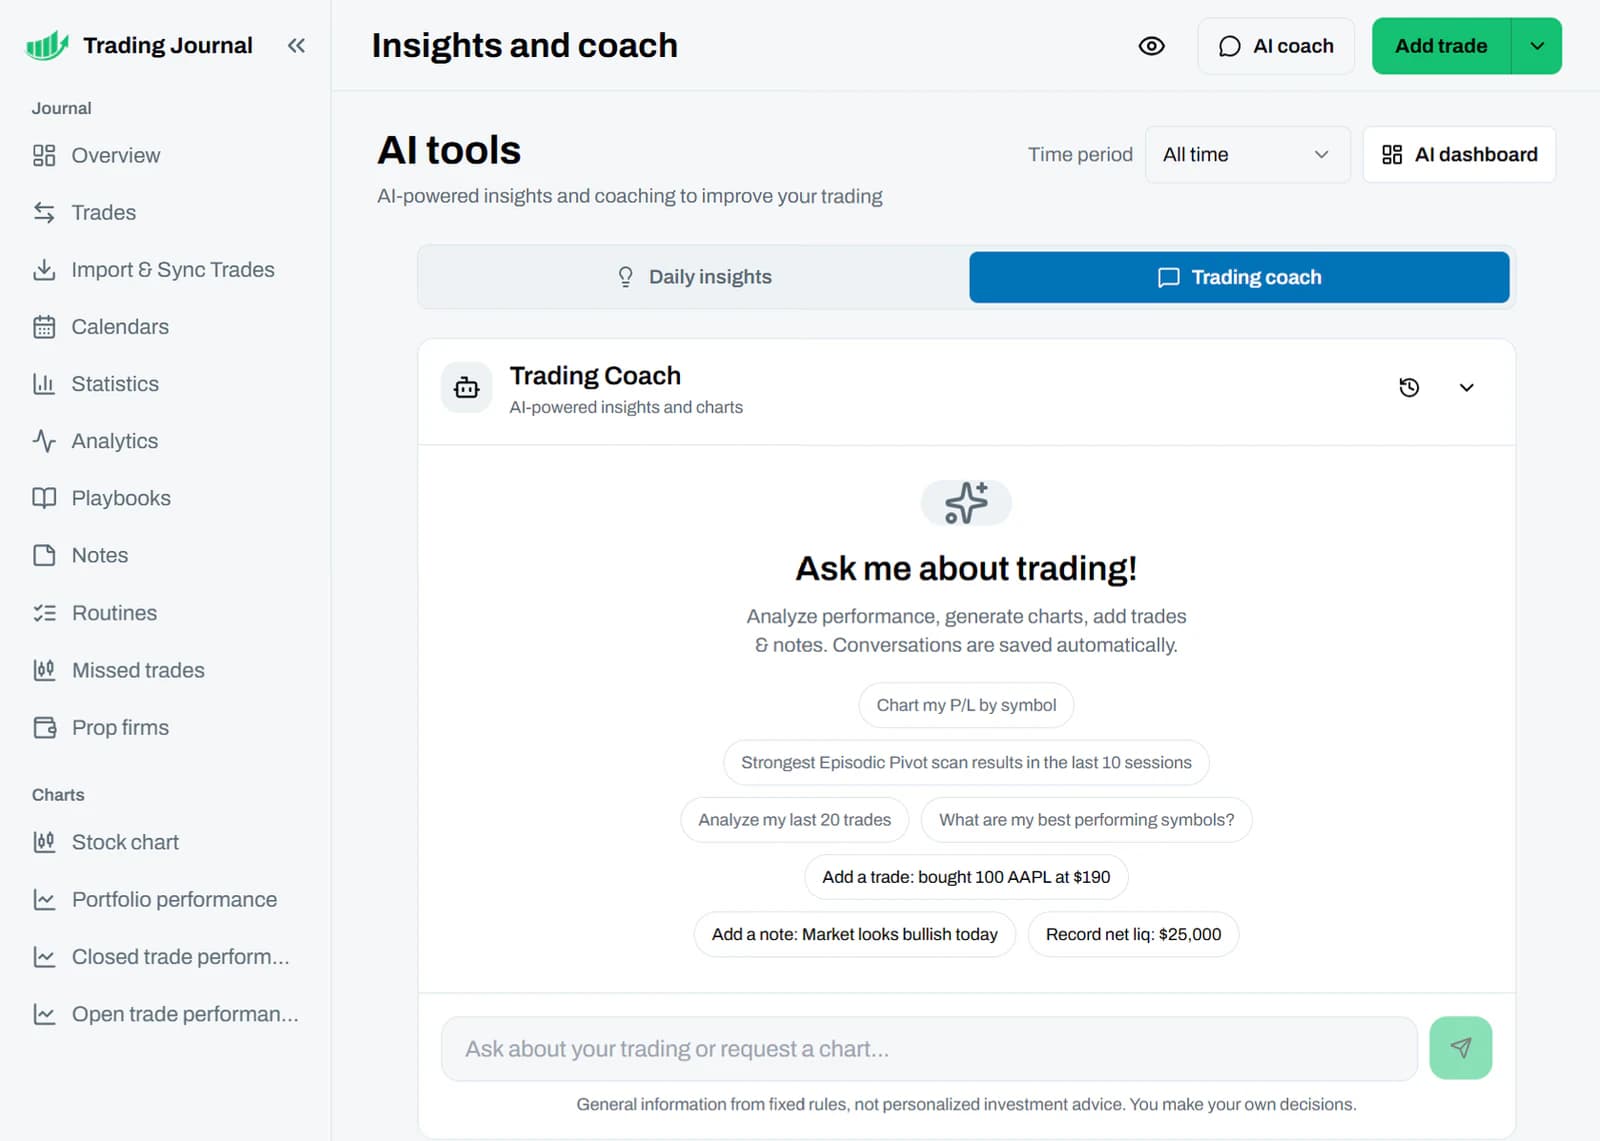
The AI Trading Coach answers from your own trades and the scanner results. Paid plan.
Broker Auto Sync Paid Connect your broker once. Trades sync every day.
Review every trade on a chart Entry, exit and stop marked on the daily chart.
AI Trading Coach and dashboards Paid Ask about your trades. Build a dashboard in plain English.
Stop manually entering trades in a spreadsheet
Typing every fill, fixing broken formulas and guessing what works costs time. Sync your broker or import a CSV and your performance builds itself.
Your spreadsheet
- Type every fill by hand
- Fix formulas when they break
- Guess which setups actually work
With the journal
- Trades sync from your broker
- Import a CSV or the free template
- Performance builds with no manual entry
Automated trade review that helps you improve
Every trade is charted, measured in R and grouped by tag, so you can see what works and where your results slip.
Broker Auto Sync
Connect any of 25+ brokers once, or upload a CSV. New trades sync every day, and several brokers can feed one journal.
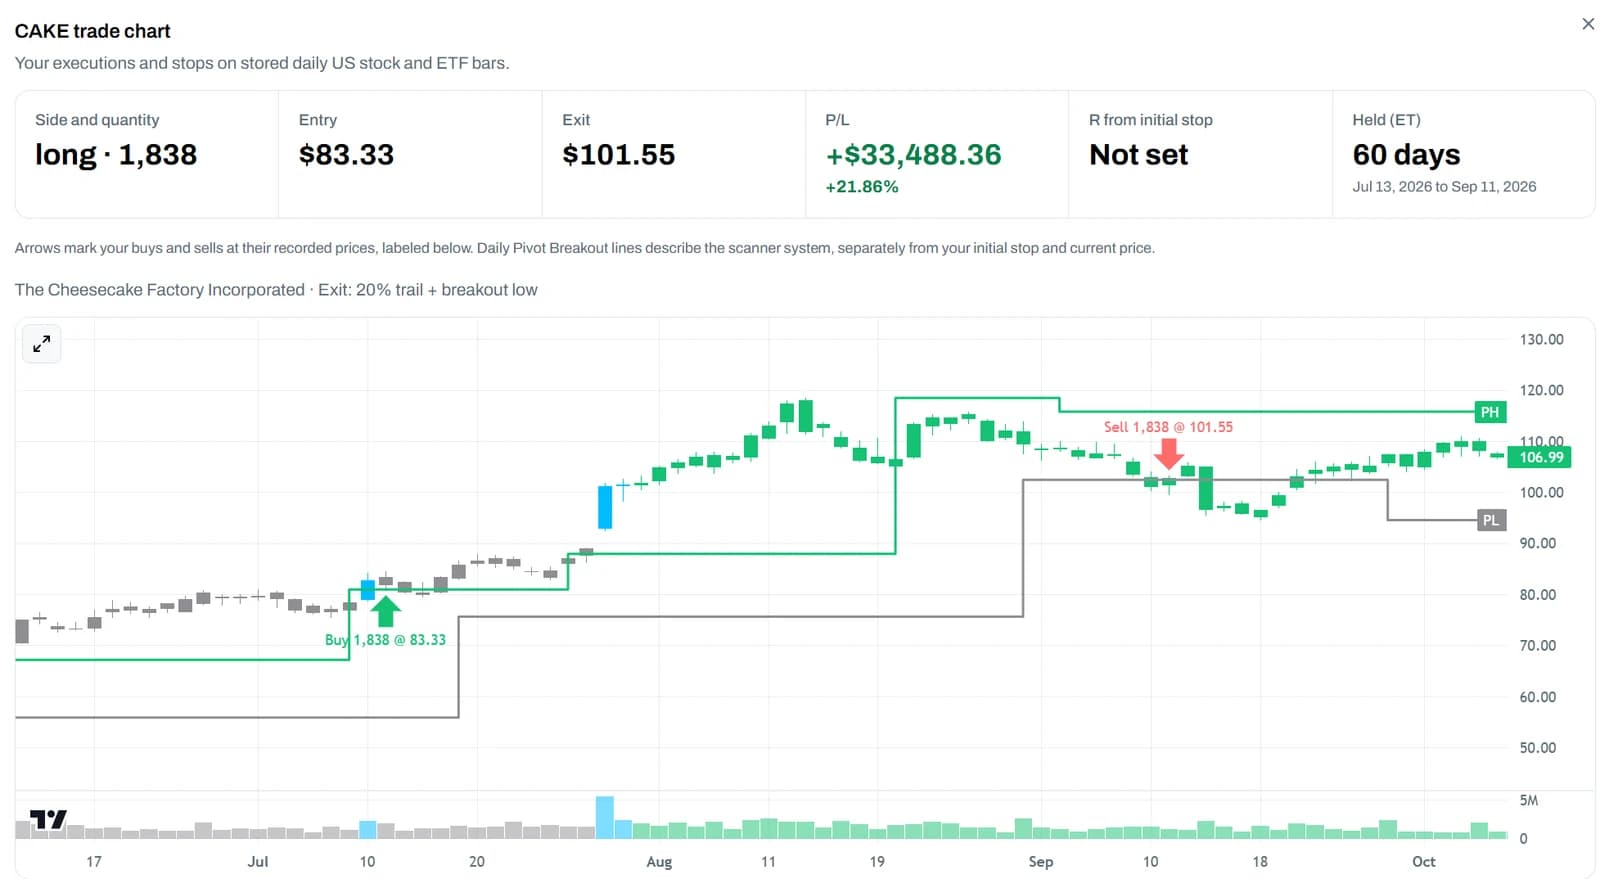
Review every trade on a chart
Every US stock or ETF trade on a daily chart with its entry, exit and initial stop, plus P/L and holding time.
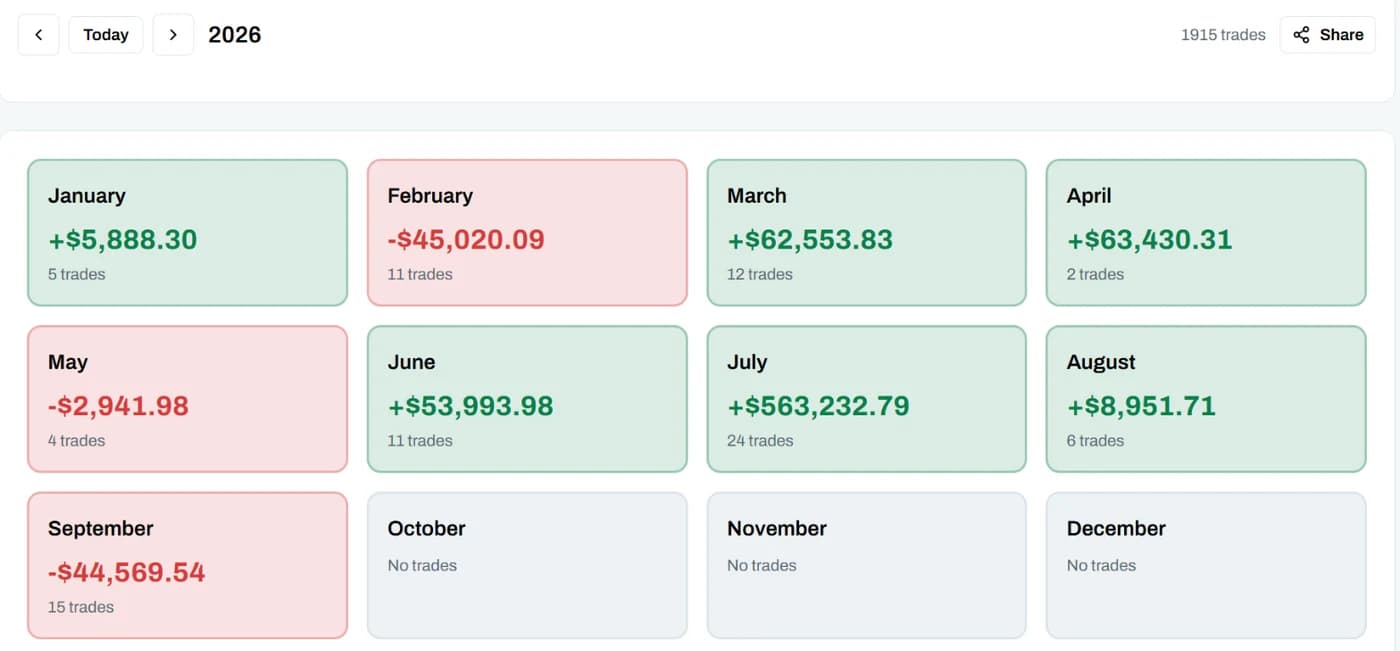
Calendar and R multiples
P/L by day, week, month or year on a calendar, in dollars, percent or R once your trades have stops.
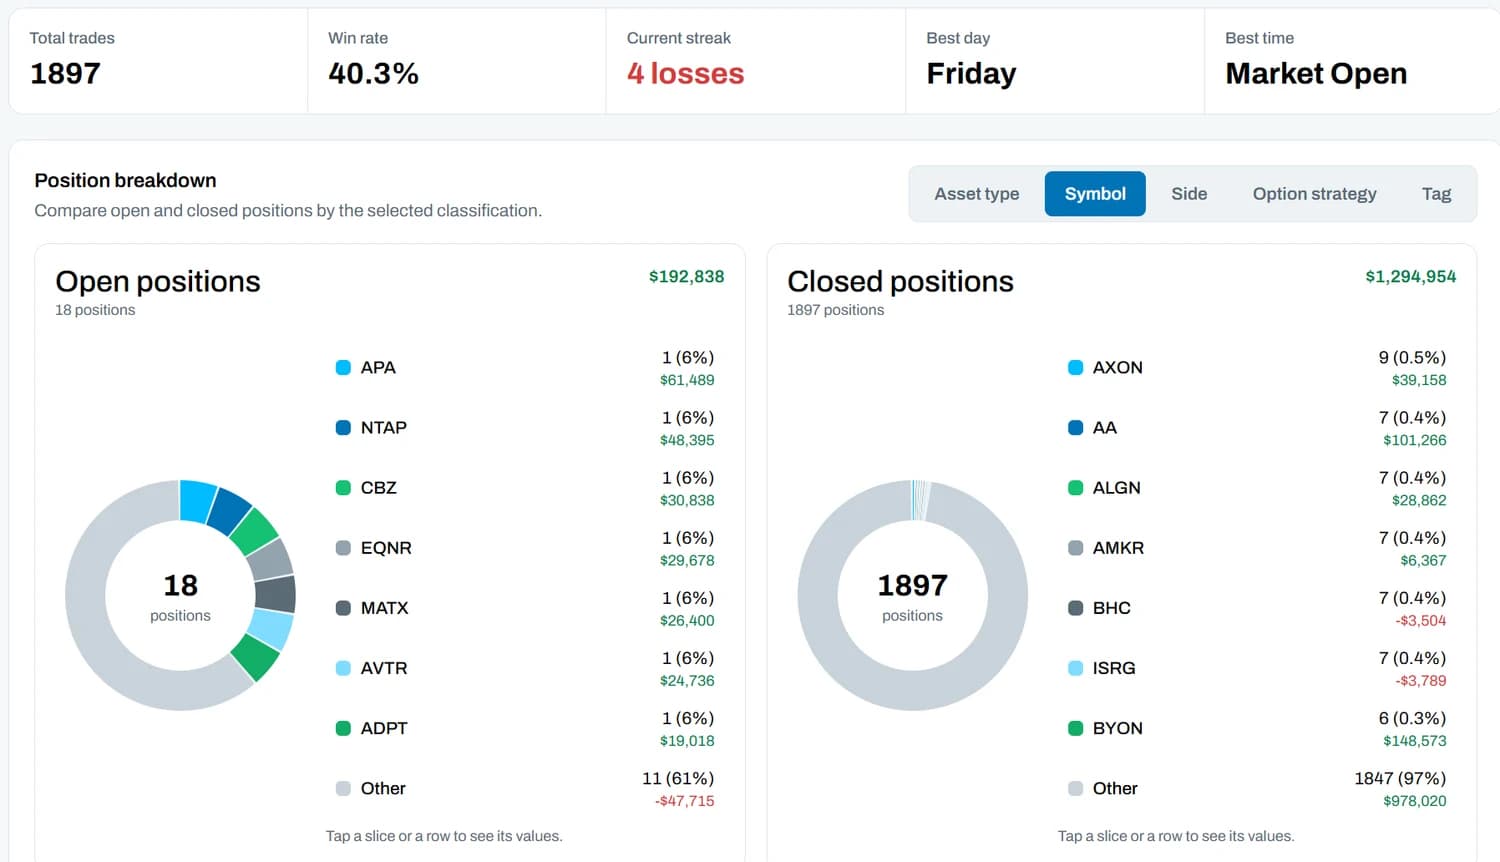
Results and expectancy by tag
Win rate, best day and time, and results and expectancy in R for each tag you assign to a setup.
Playbooks, routines and a daily journal
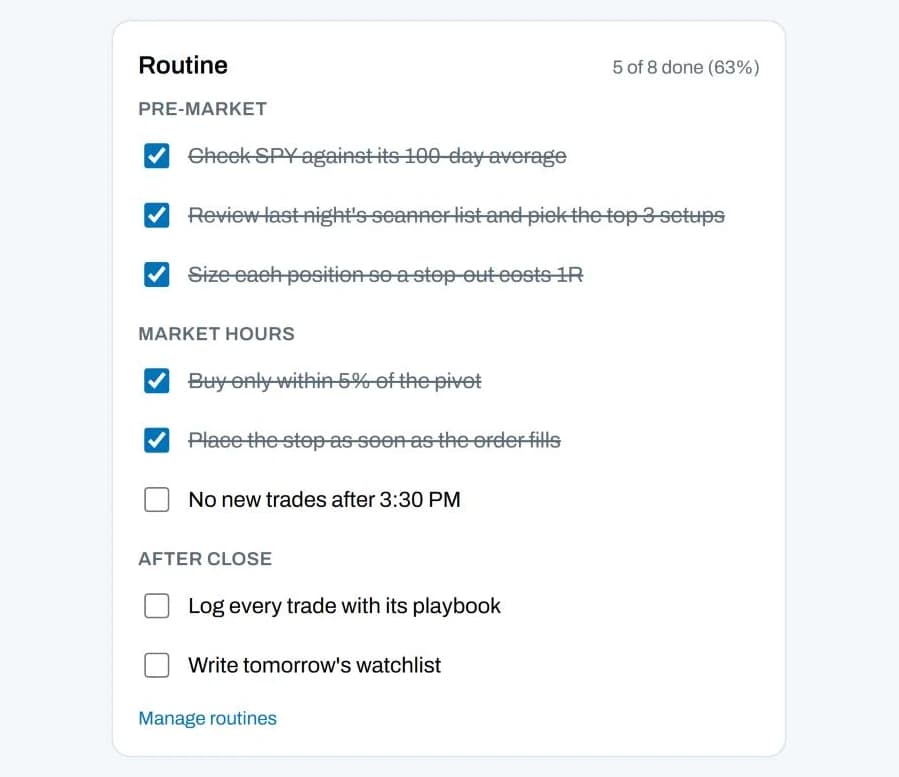
Tick a pre-market, market hours and after close routine in your day journal. Start from a ready-made playbook for each scanner, tick its rules on your trades, tag mistakes and keep notes for each day.
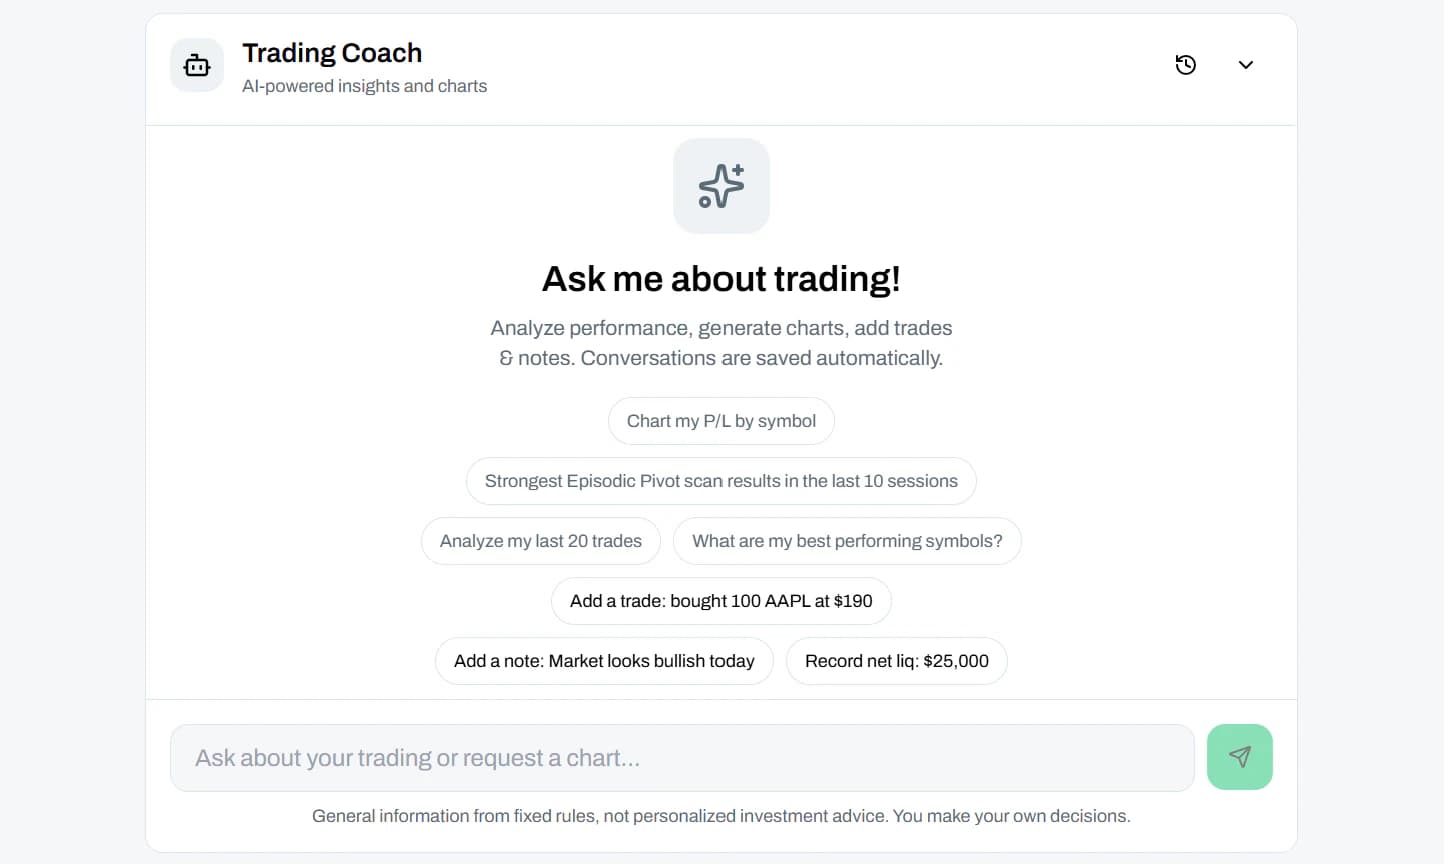
AI Trading Coach and dashboards
Ask about your trades and the scanners and get answers from your own data. It builds AI dashboards, and MCP connects your own AI tools.
Example journal with imported historical trades. Hypothetical backtest results, not actual investment returns.
Compare everything on one chart
The Official systems’ backtests are below. Bring your own backtests and portfolios into the journal and compare them on one chart, by market regime and by dates. Paid plans add the Official systems to that chart.
- Combo
- Breakout
- Dip
- SPY
Loading the test results
Drawdown from each line's high is shaded below the chart.
| System | Yearly return (CAGR) | Worst drawdown | Win rate | Average win | Average loss | Reward to risk | Trades taken |
|---|---|---|---|---|---|---|---|
| Official Combo | |||||||
| Official Breakout | |||||||
| Official Dip | |||||||
| S&P 500 (SPY) |
- Put your journals on one chart with SPY, QQQ, IWM or GLD. Paid plans add the Official systems to the same chart.
- Import your own backtest trades into a journal and compare them like any other portfolio.
- Limit the chart to any dates or a market environment such as a bull market or a crash, with drawdown under equity.
Results are hypothetical. The price history does not include delisted stocks, so results are likely better than a real account would have seen. Past results do not guarantee future results.
Prebuilt swing trading scanners
Scan the US market for classic momentum setups. Paid members get today's live and preliminary scan results during the session and the final list shortly after the close, around 4:55 PM ET. Free pages show final results, five trading sessions delayed.
Daily Pivot Breakout
Closes above the last confirmed pivot high on momentum and volume, with history since 2000.
Best for: buying breakouts from clean bases
See the free Daily Pivot scanner
Recent top results by gain since the scan alert, delayed 5 trading sessions
Loading recent results
Episodic Pivot
Today’s low at least 6% above yesterday’s high, on heavy volume.
Best for: traders who buy strong gaps
See the free Episodic Pivot scanner
Recent top results by gain since the scan alert, delayed 5 trading sessions
Loading recent results
Weinstein Stage 2
Price above a rising 30-week average and beating SPY, with quality checks.
Best for: trend followers buying early uptrends
Recent top results by gain since the scan alert, delayed 5 trading sessions
Loading recent results
VCP and VCP pivot breakouts
Minervini qualification, an established pivot, higher lows, contracting ranges and volume dry-up, plus the VCP setups that close above their pivot.
Best for: tight bases near a breakout
Recent top results by gain since the scan alert, delayed 5 trading sessions
Loading recent results
RSI divergence
Price makes a new low or high while RSI 14 does not, confirmed once the second pivot forms. Bullish and bearish.
Best for: spotting reversals before the trend turns
See the free RSI divergence scanner
Recent top results by gain since the scan alert, delayed 5 trading sessions
Loading recent results
Darvas Box
A tight box after a new 52-week high, then the first close above the box top.
Best for: buying strength after a quiet pause
See the free Darvas Box screener
Recent top results by gain since the scan alert, delayed 5 trading sessions
Loading recent results
Minervini Trend Template and Relative Strength
Leaders in the O’Neil and Minervini tradition, ranked by our Relative Strength, not IBD’s.
Best for: building a watchlist of leaders
Recent top results by gain since the scan alert, delayed 5 trading sessions
Loading recent results
More prebuilt scanners
- Golden and death cross The 50-day average crossing the 200-day, up or down.
- 9/21 EMA crossover The 9-day EMA crossing above or below the 21-day.
- Ichimoku TK crossover Tenkan and Kijun line crossovers on the daily chart.
- RSI RSI 14 crossing back above 30 or below 70, plus oversold and overbought extremes.
- CAN SLIM Stocks passing C, A, N and L, with EPS growth from SEC filings.
- Double Bottom W patterns still forming, and breakouts above the neckline.
- Momentum A 100-day rate of change of 40% or more, or a 100-day EMA up 25%.
Historical results are hypothetical and do not guarantee future results, and not every scan alert works.
Start free, upgrade when you want more
Sign up free with your email. Paid plans add Broker Auto Sync, today's live and preliminary scan results and the AI tools. Pick monthly or annual at checkout.
Free
The journal and the free pages
$0
No card needed.
Upgrade any time from inside the journal.
- Full journal: manual entry, CSV imports, stats, calendar and analytics
- Playbooks, routines, tags and ratings
- Free chart with trade replay and MAE/MFE
- Scanner results and the Official backtests, final results shown 5 trading sessions late
- Sector strength tables
- MCP and API access to your own journal, with lower limits
Monthly
Full access, no yearly bill
$19 /month
Billed $19 monthly.
Cancel anytime through Whop.
- Everything in Free, plus:
- Broker Auto Sync from 25+ brokers
- The AI Trading Coach
- Today's live and preliminary scan results
- The Official systems (Official Breakout, Official Dip, Official Combo) with full backtests
- Every API and MCP tool
- Combine any scanners and get in-app alerts when they match
- AI trade review and the dashboard builder
- Premium Financial Tech Wiz Discord community
Annual
Black Friday
Same access, lower monthly cost
$6.58 /month
$79 for your first year, then $119 a year, through Whop.
Through Monday, November 30, 11:59 PM ET.
- Everything in Free, plus:
- Broker Auto Sync from 25+ brokers
- The AI Trading Coach
- Today's live and preliminary scan results
- The Official systems (Official Breakout, Official Dip, Official Combo) with full backtests
- Every API and MCP tool
- Combine any scanners and get in-app alerts when they match
- AI trade review and the dashboard builder
- Premium Financial Tech Wiz Discord community
Historical results are hypothetical and do not guarantee future results.
Paid checkout and your subscription run through Whop. Cancel anytime there.
Questions before you start
Not answered here? Join the free Discord and ask, along with 4,000+ other traders.
Is the journal really free?
What does a paid plan add?
Which scanners are included?
When do scan results post?
How do the scanners and the journal connect?
Do I need to enter my portfolio balance every day?
How closely does it match my broker account?
Can I combine accounts or keep them separate?
What happens when historical prices are missing?
What is the Financial Tech Wiz Trading Journal?
How do I get my trades into the journal?
Which brokers does the Financial Tech Wiz Trading Journal support?
What can I review for each trade?
Which benchmarks can I compare against?
What does the Daily Pivot Breakout Scanner include?
Can I see how past breakouts played out?
What can I ask the AI Trading Coach?
What is the AI dashboard builder?
Can I connect my own AI tools to the journal?
Is there a free version of the scanner?
Does it work for day traders?
How do pricing, billing and cancelling work?
Let the journal do the review work
Sign up free with your email. Paid plans are $19/month or $119/year billed yearly through Whop. Join 1,300+ traders who have signed up.
Pivot high Breakout