The Coin Daily Research
officialLive crypto charts, funding and market context from The Coin Daily's research desk.
What can you do with The Coin Daily Research MCP?
- Explore price moves on the chart — Ask your assistant to walk through how an asset moved from point A to B, with hourly candles and replay controls.
- Compare crypto groups and cohorts — Ask whether a whole category moved or just a few members, and see contributions and relationships between assets.
- Read the Desk Brief for market context — Ask what the Market Update reported at a specific time, including news and video timelines.
- Check market activity and volatility — Ask if a market is unusually quiet or active, and get plain-English explanations of RSI, funding, or depth readings.
- Discover tokens by category — Ask which tokens belong to a given market or taxonomy, and identify the right widget to display the answer.
Hosted MCP Server
npx add-mcp 'https://mcp.thecoindaily.co/mcp'Installs into Claude Code, Codex, Cursor and more
Documentation
The Coin Daily research guide
Start with a market question. This guide shows you which view to open, which controls matter and how to read what you find.
- Explore on the chart Use Research Desk to inspect an asset, compare crypto groups and read the Desk Brief. Start with the price move, then add context. Open the Research walkthrough
- Explore in conversation Connect Claude or ChatGPT, ask your question and inspect a focused widget. Ask follow-ups without learning tool names. Connect your assistant · Questions to try
Use the same verified email at checkout, in Research and when connecting your assistant. Our news website and public videos remain free.
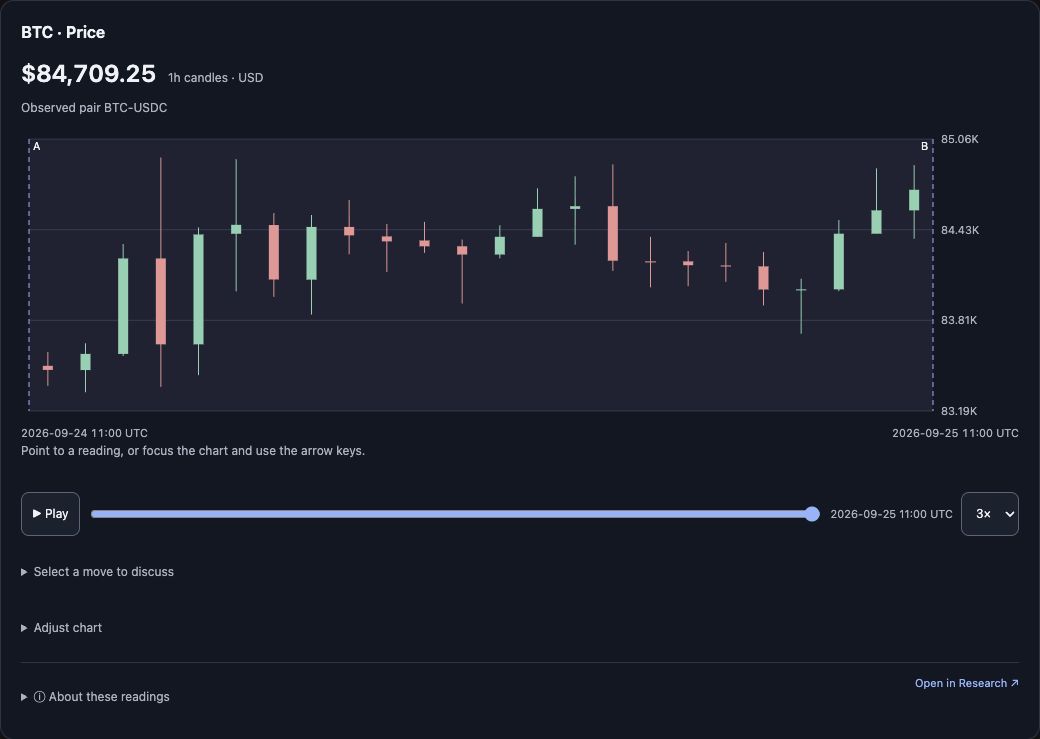
The actual MCP price widget, captured 25 September 2026: BTC · Price, 1-hour candles, 2026-09-24 11:00 → 2026-09-25 11:00 UTC. Select the screenshot to enlarge it. See more widgets.
What are you trying to understand?
| Your question | Open this guide |
|---|---|
| How did an asset get from A to B? | Price moves, layers and range explanations |
| Did a whole group move—or just a few members? | Cohorts, contributions and relationships |
| Which tokens belong to this category? | Markets, Tickers and Taxonomy |
| What did the Market Update report at the time? | Desk Brief, news and video timelines |
| Is this market unusually quiet or active? | Market regime and volatility |
| What do RSI, funding or depth actually tell me? | Readings in plain English |
| Which chart should I ask my assistant to show? | All 14 widgets |
First visit?
Start here for sign-in and a first investigation. Plans include Research and MCP together; your AI provider's plan is separate. If you already subscribe—or hold active complimentary access— open Research or connect your assistant with the same verified checkout email.
Can't get in? · Sign in & accounts · Manage your subscription
Go deeper when you need to
The reading and timing guide explains source clocks, units and coverage. The technical reference documents all 28 tools and the evidence used by the 14 widget families. You do not need either reference to start exploring.
Research describes observed markets. It does not place trades or provide personalised investment advice.