Radar MCP Server
Kubernetes observability and diagnostics MCP server for cluster health, workload diagnosis, logs, events, topology, audit findings, and remediation actions.
Documentation
Radar
![]()
Modern Kubernetes visibility.
Local-first. No account. No cloud dependency. Blazing Fast.
🌐 radarhq.io · Docs · Releases
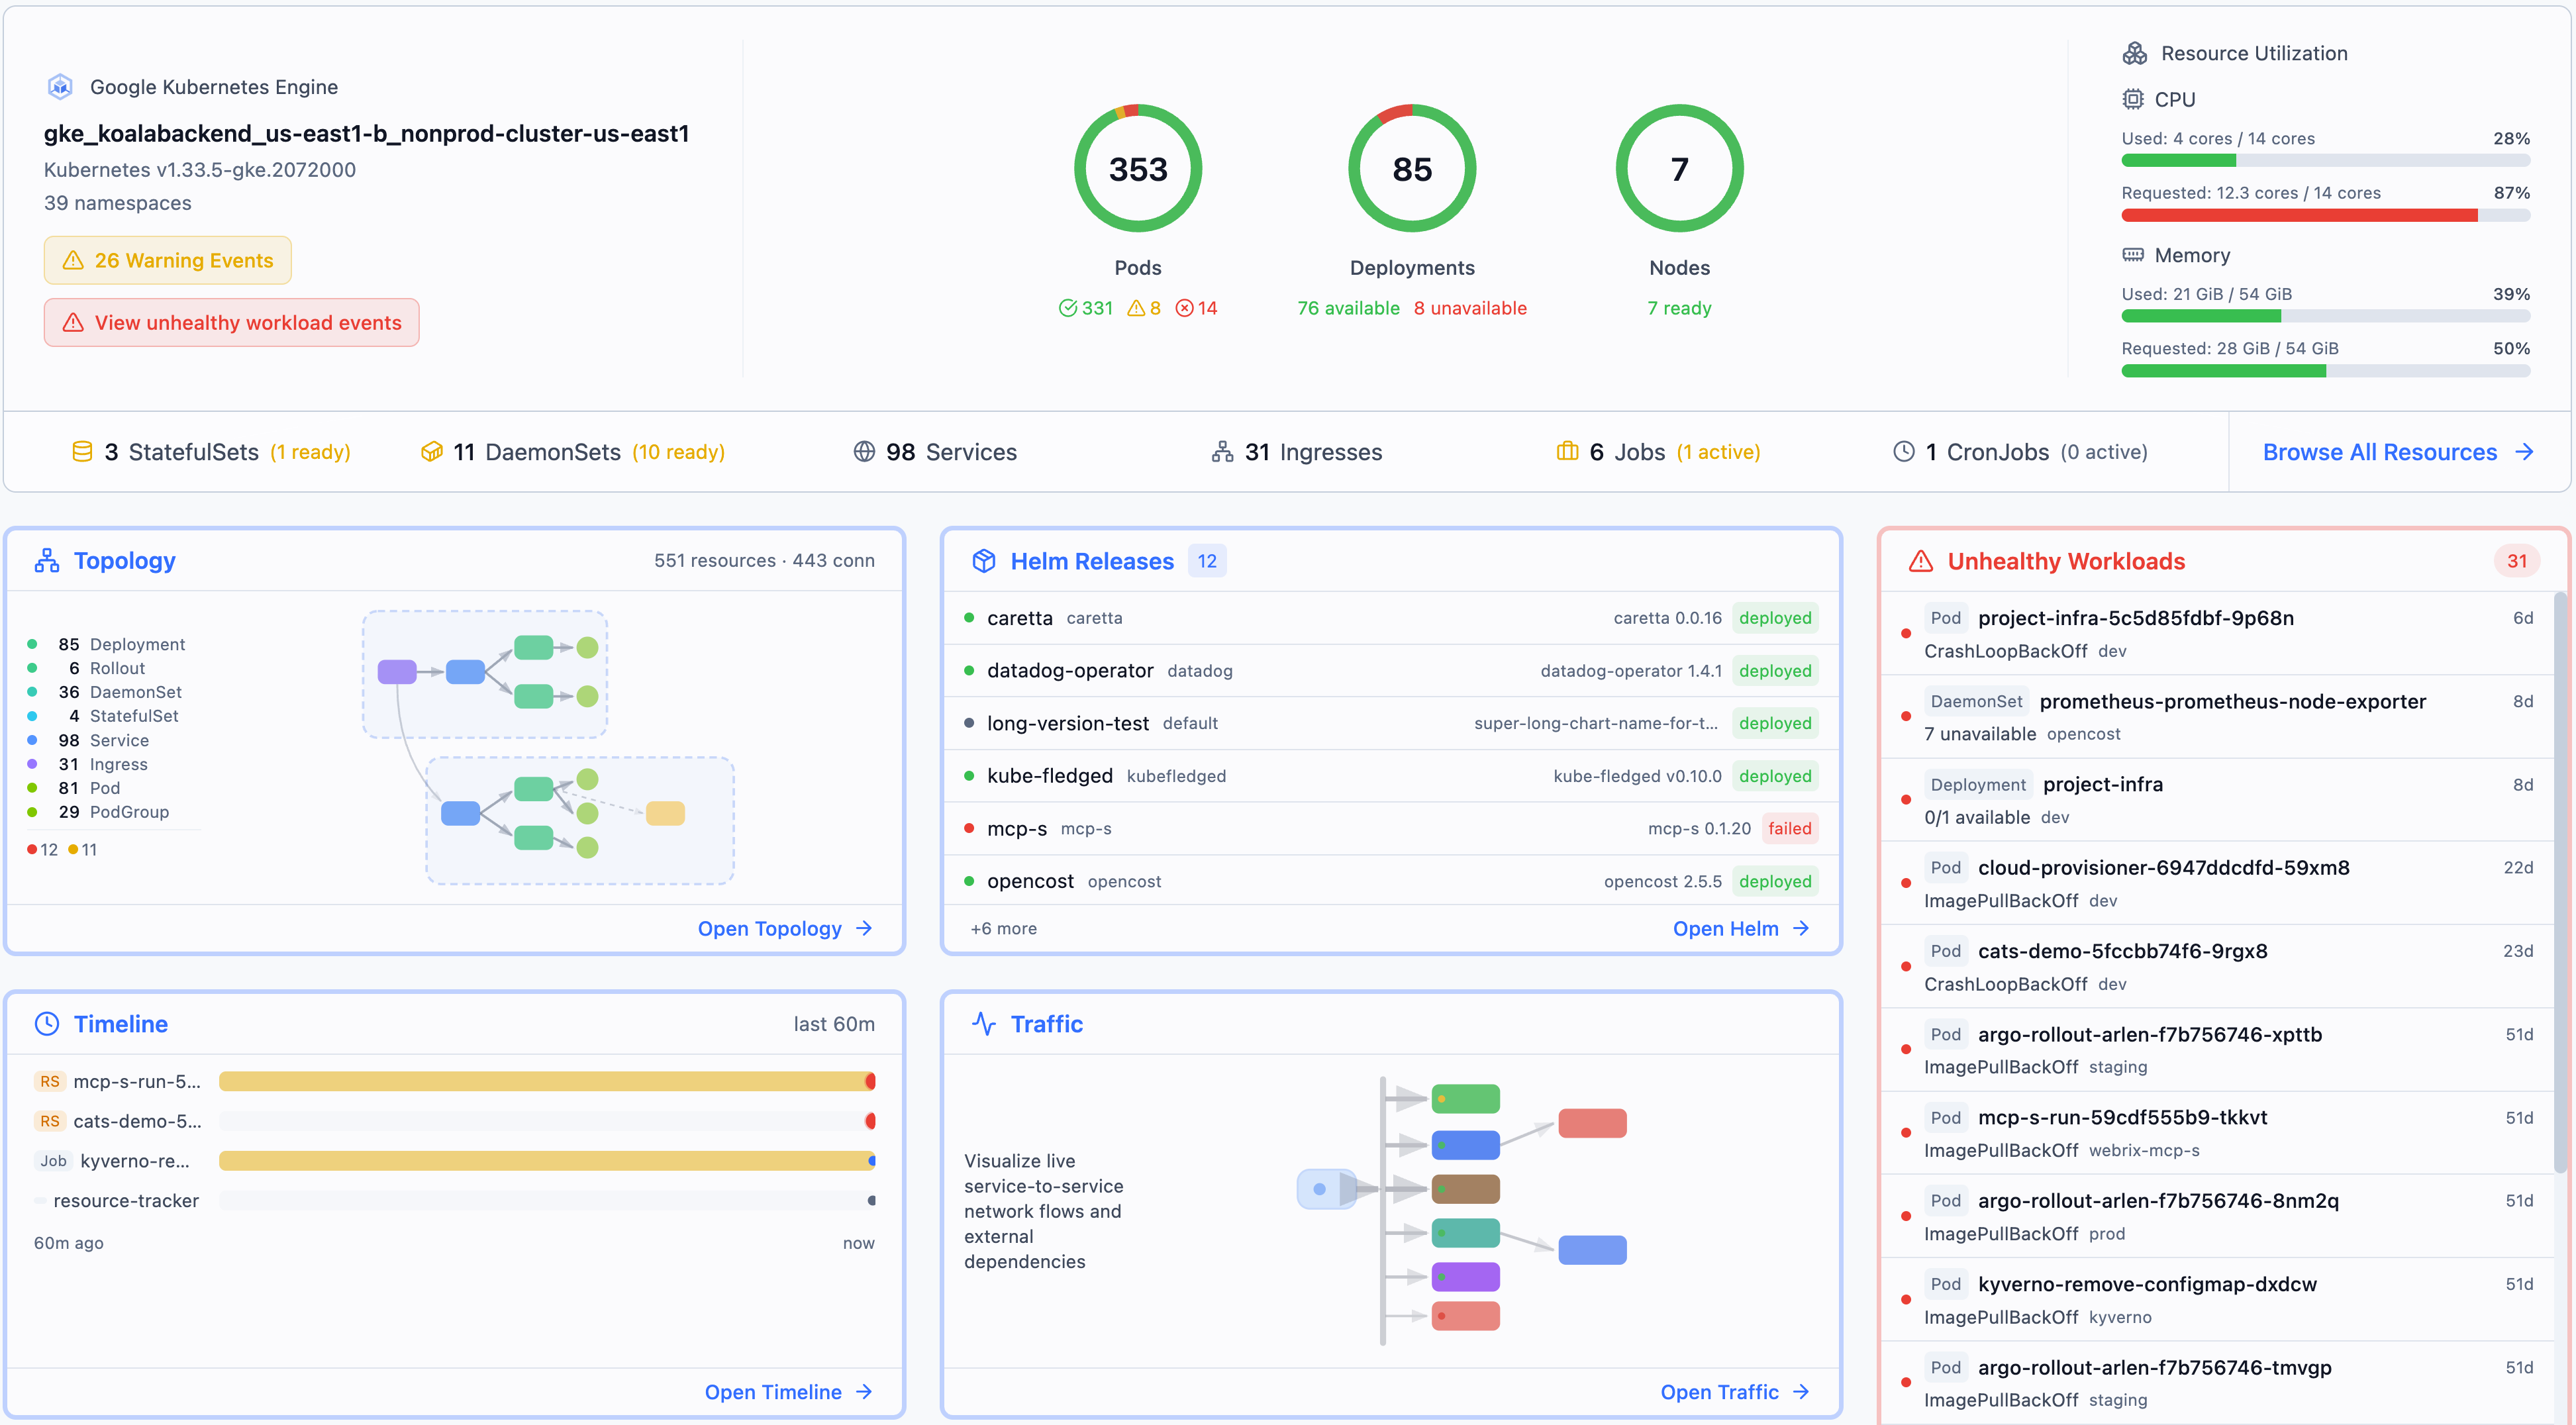
Topology, event timeline, and service traffic — plus resource browsing, Helm management, and GitOps support for FluxCD and ArgoCD.
![]()


![]()
Visualize your cluster topology, browse resources, stream logs, exec into pods, inspect container image filesystems, manage Helm releases, monitor GitOps workflows (FluxCD & ArgoCD), and forward ports - all from a single binary with zero cluster-side installation.
Install and run in 30 seconds:
curl -fsSL https://get.radarhq.io | sh && kubectl radar
Why Radar?
- Zero install on your cluster — runs on your laptop, talks to the K8s API directly
- Single binary — no dependencies, no agents, no CRDs
- Blazing fast - smart caching, progressive loading, parallelization and other optimizations
- Airgapped-ready — no external network calls, works in isolated environments
- Real-time — watches your cluster via informers, pushes updates to the browser via SSE
- Works everywhere — GKE, EKS, AKS, minikube, kind, k3s, or any conformant cluster
- AI-ready — built-in MCP server lets AI assistants query your cluster through Radar
- In-cluster option — deploy with Helm for shared team access with RBAC-scoped permissions
Installation
Quick Install:
curl -fsSL https://get.radarhq.io | sh
Homebrew:
brew install skyhook-io/tap/radar
Then run: kubectl radar (or simply radar)
More install options — Desktop App (macOS/Linux/Windows), Krew, Scoop, In-Cluster Helm
CLI
Krew (kubectl plugin manager):
kubectl krew install radar
Scoop (Windows):
scoop bucket add skyhook https://github.com/skyhook-io/scoop-bucket
scoop install radar
PowerShell (Windows):
irm https://get.radarhq.io/install.ps1 | iex
Direct download — GitHub Releases for macOS, Linux, or Windows.
Desktop App
Native desktop app — no terminal needed.
Homebrew (macOS):
brew install --cask skyhook-io/tap/radar-desktop
Debian/Ubuntu:
sudo apt install ./radar-desktop_*.deb
Fedora/RHEL:
sudo rpm -i radar-desktop_*.rpm
Scoop (Windows):
scoop bucket add skyhook https://github.com/skyhook-io/scoop-bucket
scoop install radar-desktop
Windows (direct download) — GitHub Releases.
In-Cluster Deployment
Deploy to your cluster for shared team access:
helm repo add skyhook https://skyhook-io.github.io/helm-charts
helm install radar skyhook/radar -n radar --create-namespace
See the In-Cluster Deployment Guide for ingress, authentication, and RBAC configuration.
Usage
# Opens browser automatically
kubectl radar

# Or simply
radar
CLI Flags
| Flag | Default | Description |
|---|---|---|
--kubeconfig | ~/.kube/config | Path to kubeconfig file |
--kubeconfig-dir | Comma-separated directories containing kubeconfig files | |
--namespace | (all) | Initial namespace filter (supports multi-select in the UI; also used as RBAC fallback for namespace-scoped users) |
--port | 9280 | Server port |
--no-browser | false | Don't auto-open browser |
--browser | Browser to use when opening the UI, e.g. firefox, google-chrome, or Google Chrome on macOS | |
--timeline-storage | memory | Timeline storage backend: memory or sqlite |
--timeline-db | ~/.radar/timeline.db | Path to SQLite database (when using sqlite storage) |
--timeline-max-size | 1Gi | Maximum SQLite DB + WAL size before pruning oldest events (e.g. 800Mi, 8Gi; 0 disables) |
--history-limit | 10000 | Maximum events to retain in timeline |
--disable-exec | false | Disable terminal and debug shell |
--disable-helm-write | false | Disable Helm write operations |
--disable-local-terminal | false | Disable local terminal feature |
--debug-image | busybox:latest | Image for ephemeral debug containers and node debug pods. Point at a mirror for air-gapped / private-registry clusters. |
--list-page-size | 0 (off) | Paginate the initial LIST of high-cardinality kinds (Pods, ReplicaSets) at this size. Helps very large clusters that fail to sync; only used when WatchList streaming is unavailable. Try 2000. |
--context-switch-timeout | 30s | Maximum time a kubeconfig context switch may take. Widen on high-latency control planes — see Tuning for slow clusters. Env: RADAR_CONTEXT_SWITCH_TIMEOUT. |
--first-paint-backstop | 5m | Hard upper bound on the initial critical-cache sync wait before Radar falls through to a partial-data render. Env: RADAR_FIRST_PAINT_BACKSTOP. |
--namespace-list-timeout | 5s | Timeout for the cluster-wide namespace LIST used to decide if the user is RBAC-namespace-restricted. A timeout on a slow control plane is misreported in the UI as "Limited list — RBAC". Env: RADAR_NAMESPACE_LIST_TIMEOUT. |
--max-scope-candidates | 20 | Cap on the namespace-fallback probe fanout (used by accounts that can list namespaces cluster-wide but not list a specific kind cluster-wide). Raise above 20 for clusters with more than 20 namespaces. Env: RADAR_MAX_SCOPE_CANDIDATES. |
--prometheus-url | (auto-discover) | Manual Prometheus/VictoriaMetrics URL (skips auto-discovery) |
--prometheus-header | HTTP header sent with every Prometheus request, format Key=Value (repeatable). Required for auth-protected backends. | |
--prometheus-header-from-env | HTTP header sent with every Prometheus request, sourced from an environment variable, format Key=ENV_VAR (repeatable). | |
--auth-mode | none | Authentication mode: none, proxy, or oidc (details) |
--no-mcp | false | Disable MCP server for AI tool integration |
--mcp-catalog-stdio | false | Start only the MCP catalog over stdio for registry introspection |
--version | Show version and exit |
See Configuration Guide for details on cluster connection precedence, multiple kubeconfig files, and context switching.
Tuning for slow or high-latency clusters
The default deadlines (30 s context switch, 5 m first-paint backstop, 5 s namespace LIST, 20 scope candidates) are tuned for healthy clusters reached over fast, low-latency connections. They are too tight for clusters reached over SSH tunnels, geographically distant control planes, or accounts subject to API-server throttling, where they surface as one of three symptoms:
- "Context switch timed out" toasts when the cache eventually does sync
- "Limited list — RBAC doesn't allow listing all namespaces" even though the account has cluster-wide list permission (the LIST timed out, not RBAC)
- Kinds silently marked denied because the namespace they live in fell past the 20-entry candidate cap
Widen the four flags via CLI or via the matching environment variables
(RADAR_CONTEXT_SWITCH_TIMEOUT, RADAR_FIRST_PAINT_BACKSTOP,
RADAR_NAMESPACE_LIST_TIMEOUT, RADAR_MAX_SCOPE_CANDIDATES) — env vars
keep secrets out of ps and let in-cluster deployments source the values
from a ConfigMap:
# CLI
kubectl radar \
  --context-switch-timeout=120s \
  --first-paint-backstop=10m \
  --namespace-list-timeout=30s \
  --max-scope-candidates=200

# Environment (e.g. in a Deployment manifest)
RADAR_CONTEXT_SWITCH_TIMEOUT=120s \
RADAR_FIRST_PAINT_BACKSTOP=10m \
RADAR_NAMESPACE_LIST_TIMEOUT=30s \
RADAR_MAX_SCOPE_CANDIDATES=200 \
  kubectl radar
Defaults are preserved when neither the flag nor the env var is set, so existing deployments are unaffected.
Views
Topology
Interactive graph showing how your Kubernetes resources are connected in real-time.
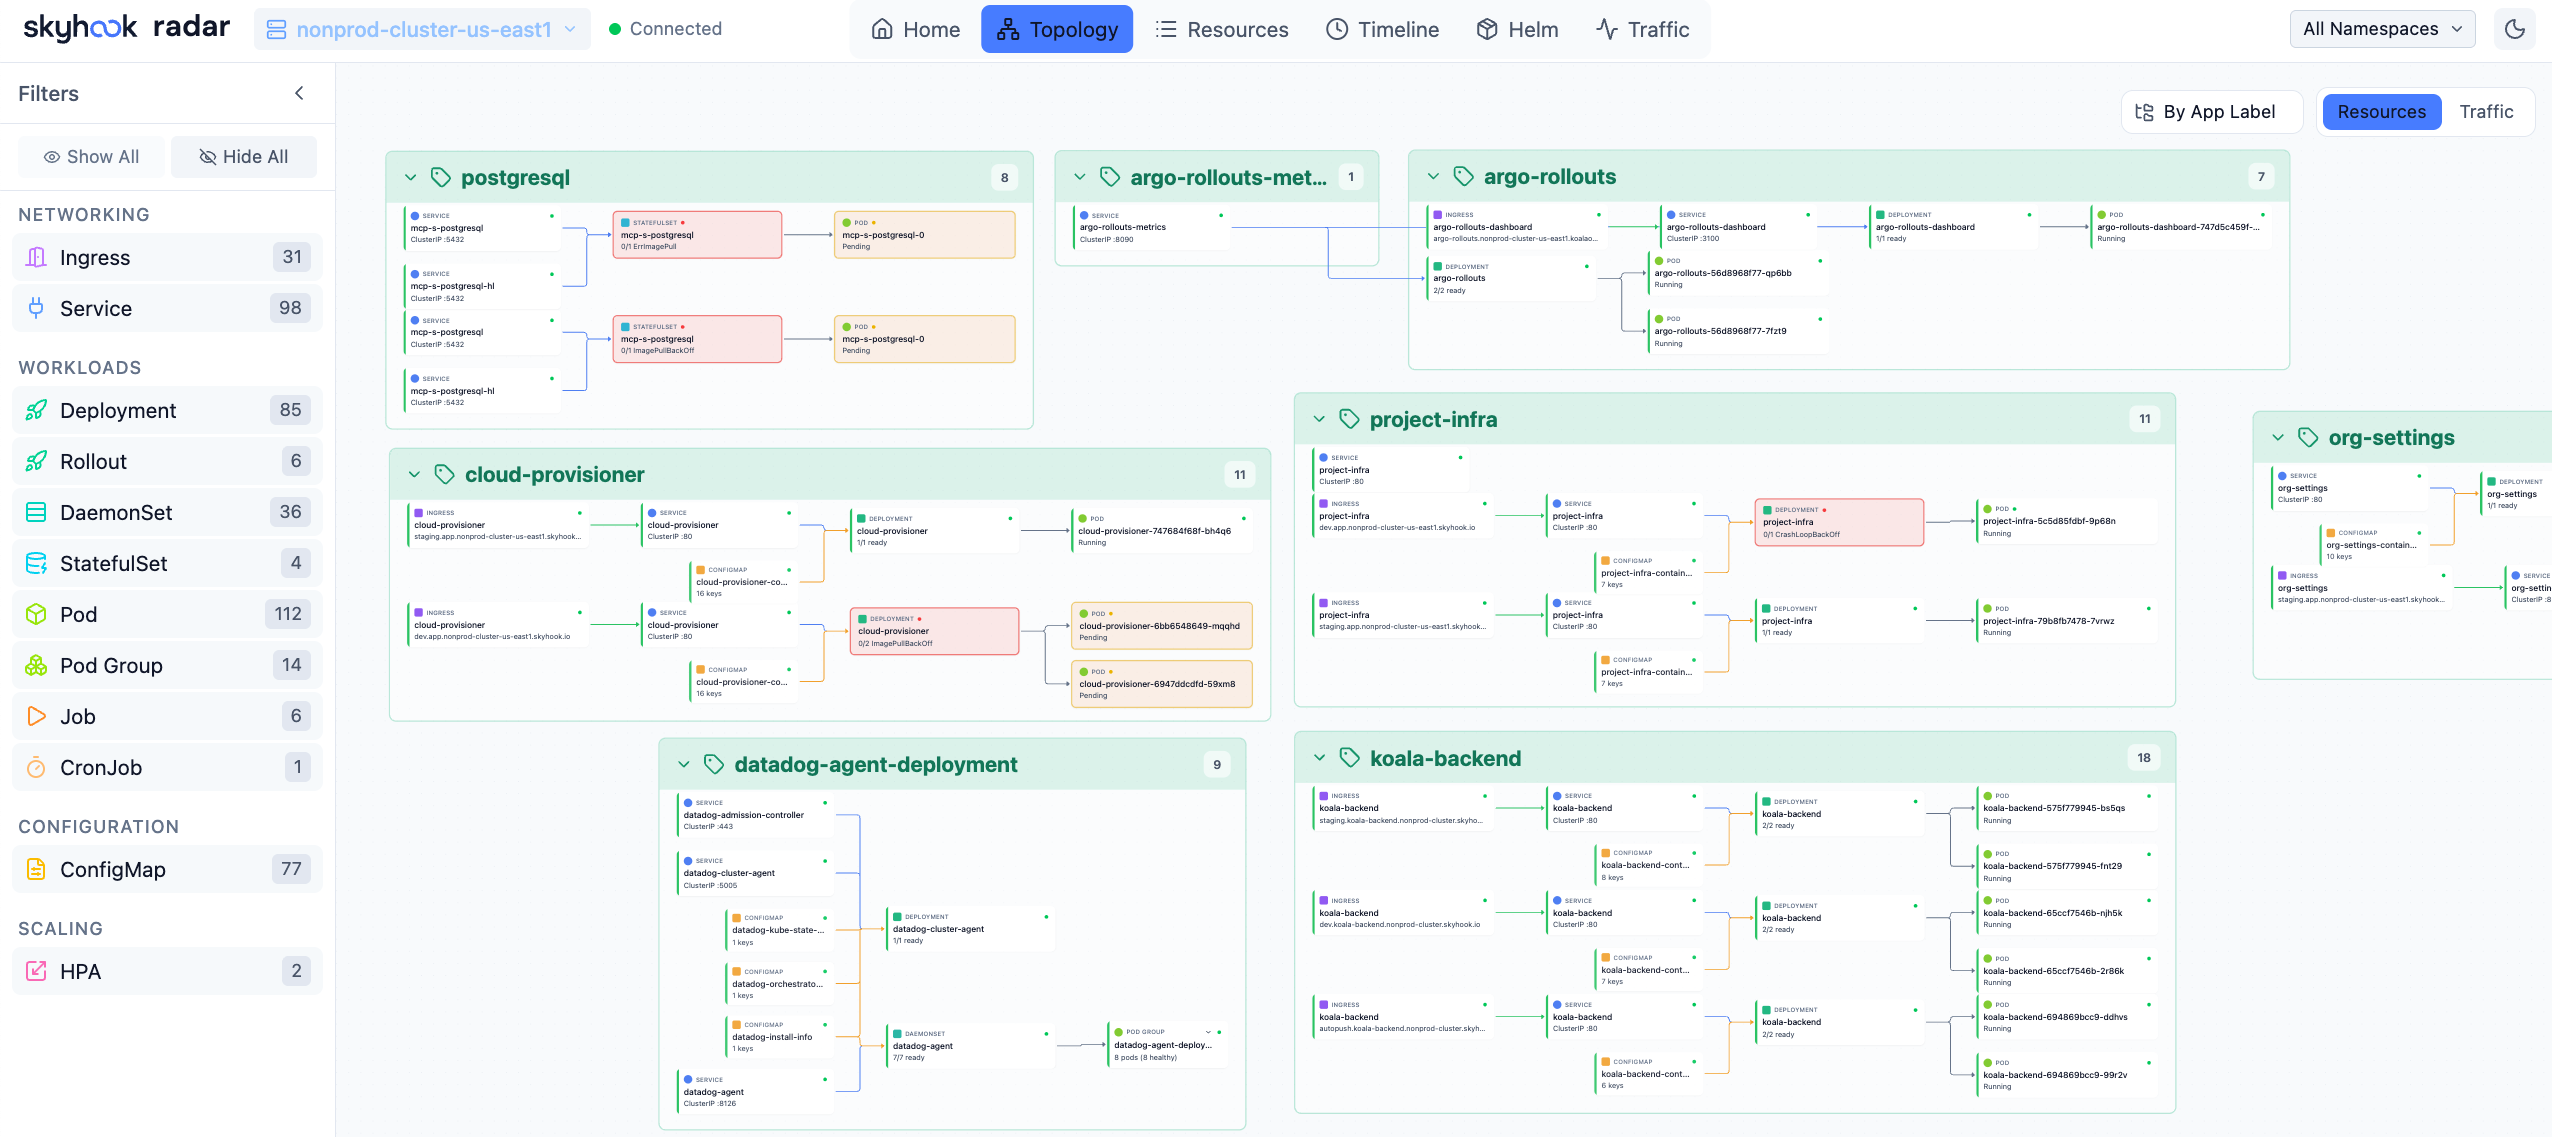
Topology View — Visualize resource relationships
- Two modes: Resources (full hierarchy) and Traffic (network flow path)
- Group by namespace, app label, or view ungrouped
- Filter by resource kind — click any node for full details
- Auto-layout powered by ELK.js, live updates via SSE
Resources
Table-based resource browser with smart columns per resource kind.
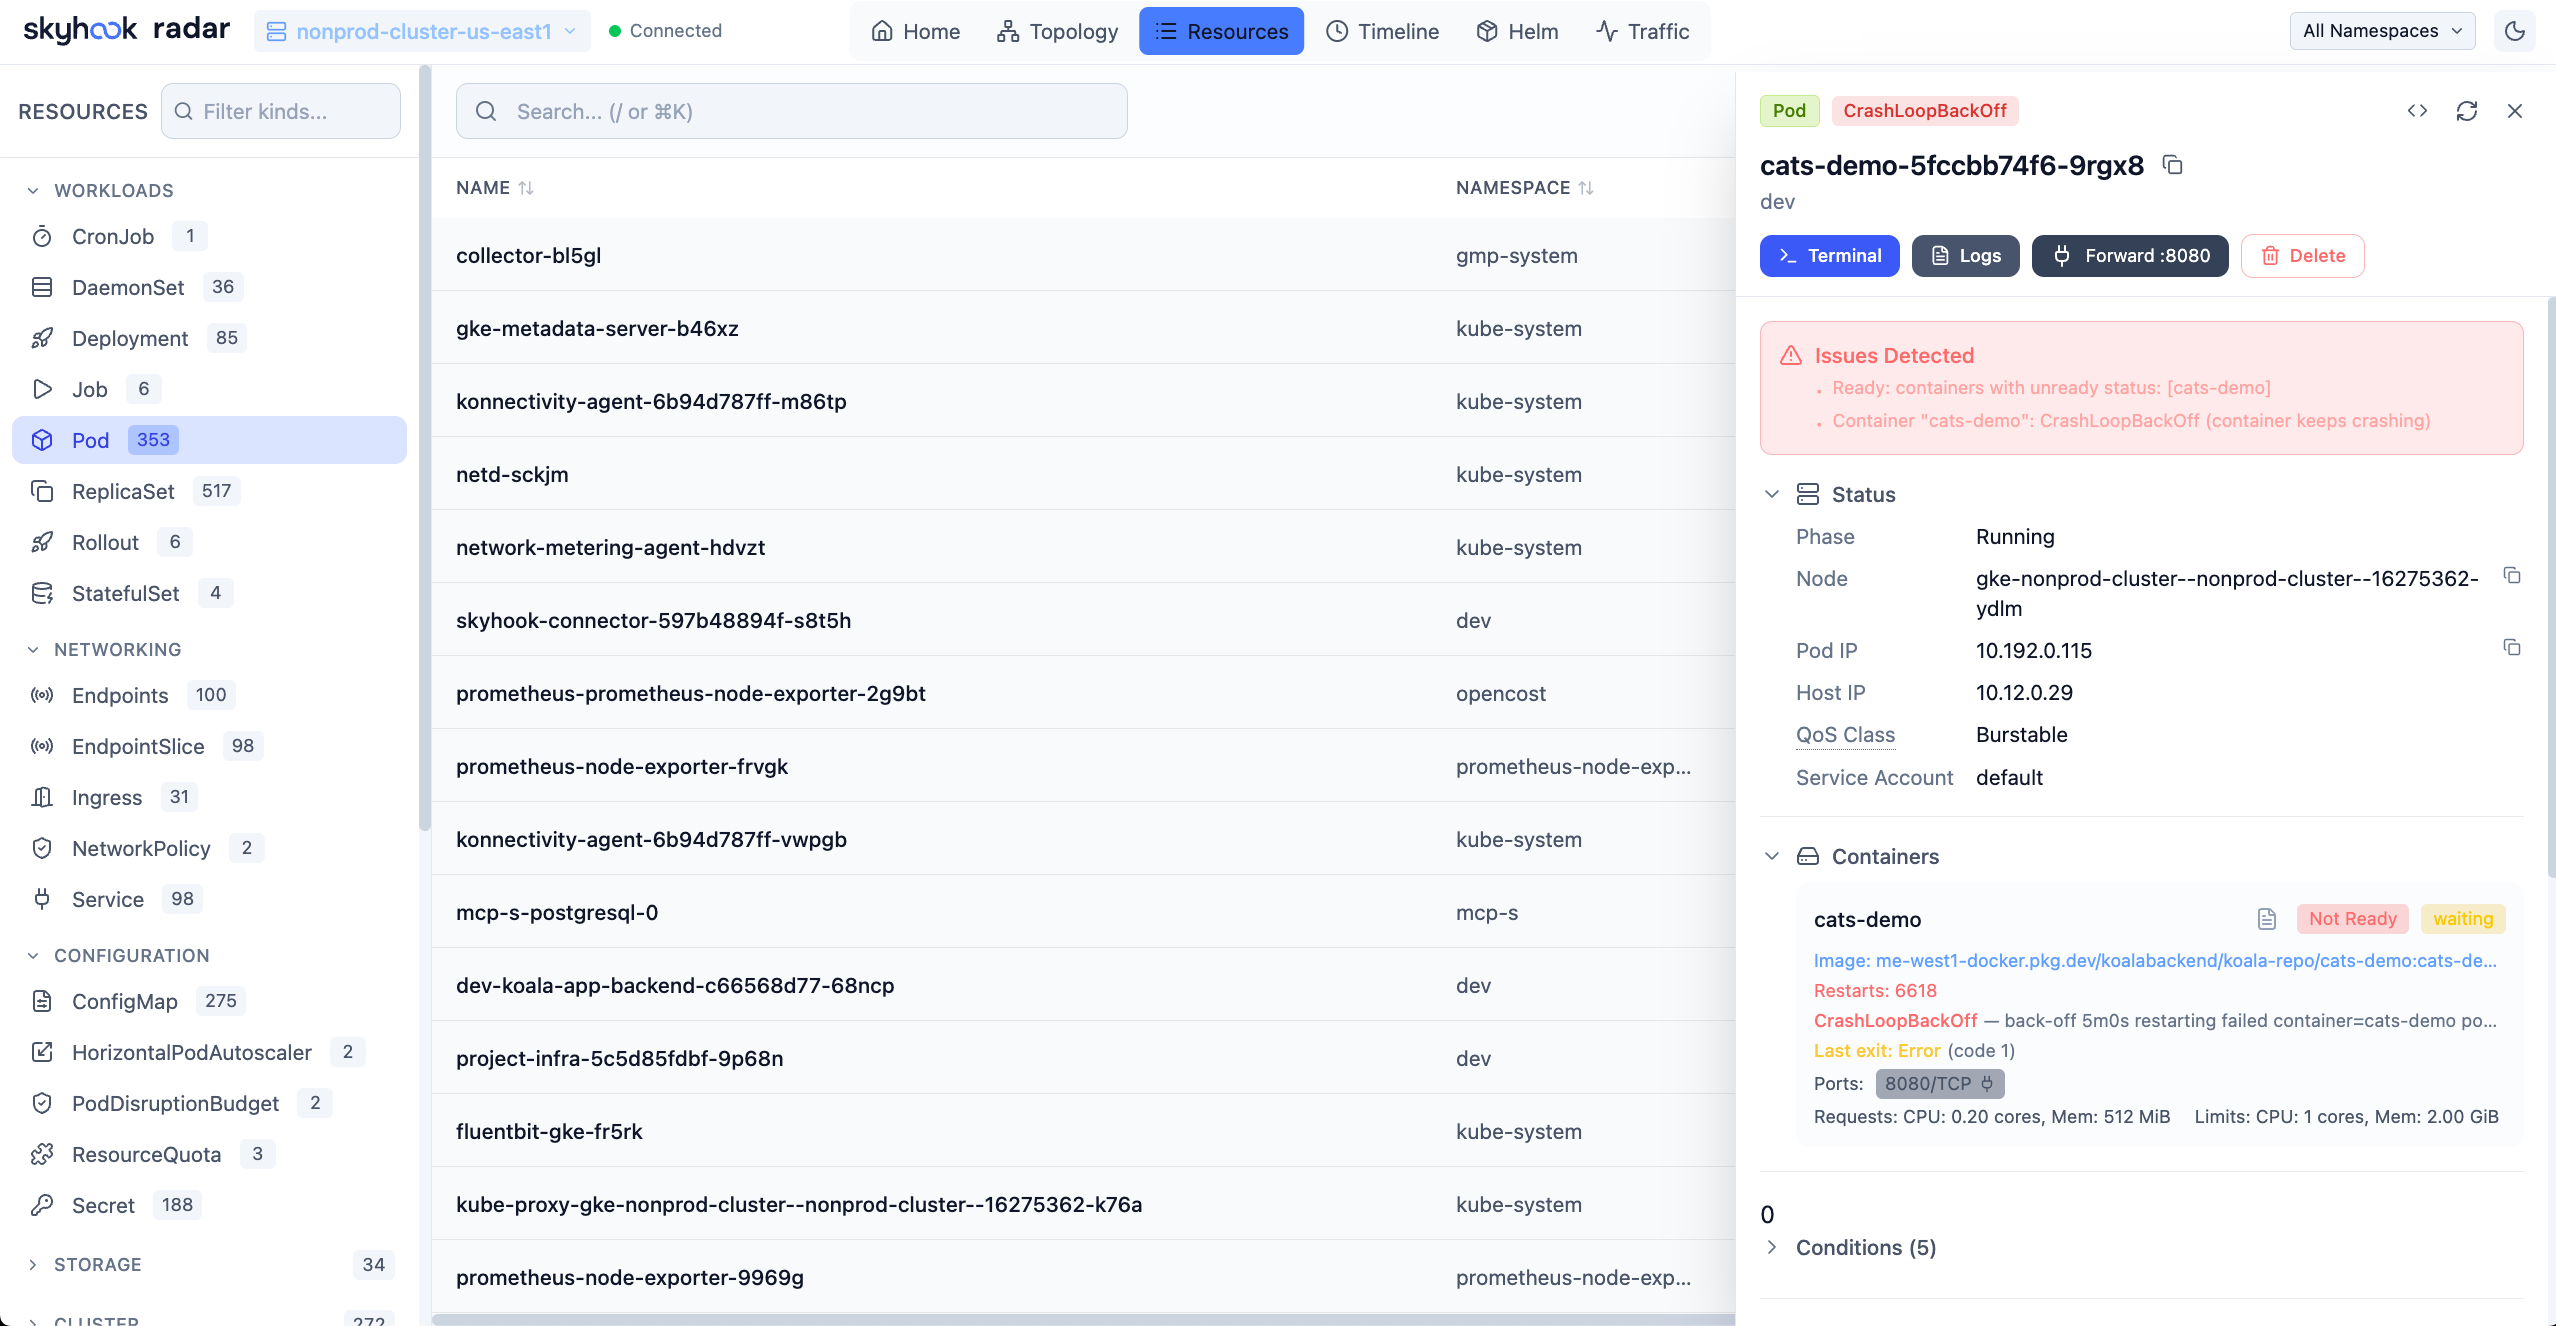
Resources View — Browse and filter all cluster resources
- Browse all resource types including CRDs
- Search by name, filter by status or problems (CrashLoopBackOff, ImagePullBackOff, etc.)
- Add custom columns from any label or annotation — sortable, filterable, and resizable
- Click any resource for YAML manifest, related resources, logs, and events
Image Filesystem Viewer
Inspect container image filesystems directly from the Pod view — no need to pull images locally or exec into containers.
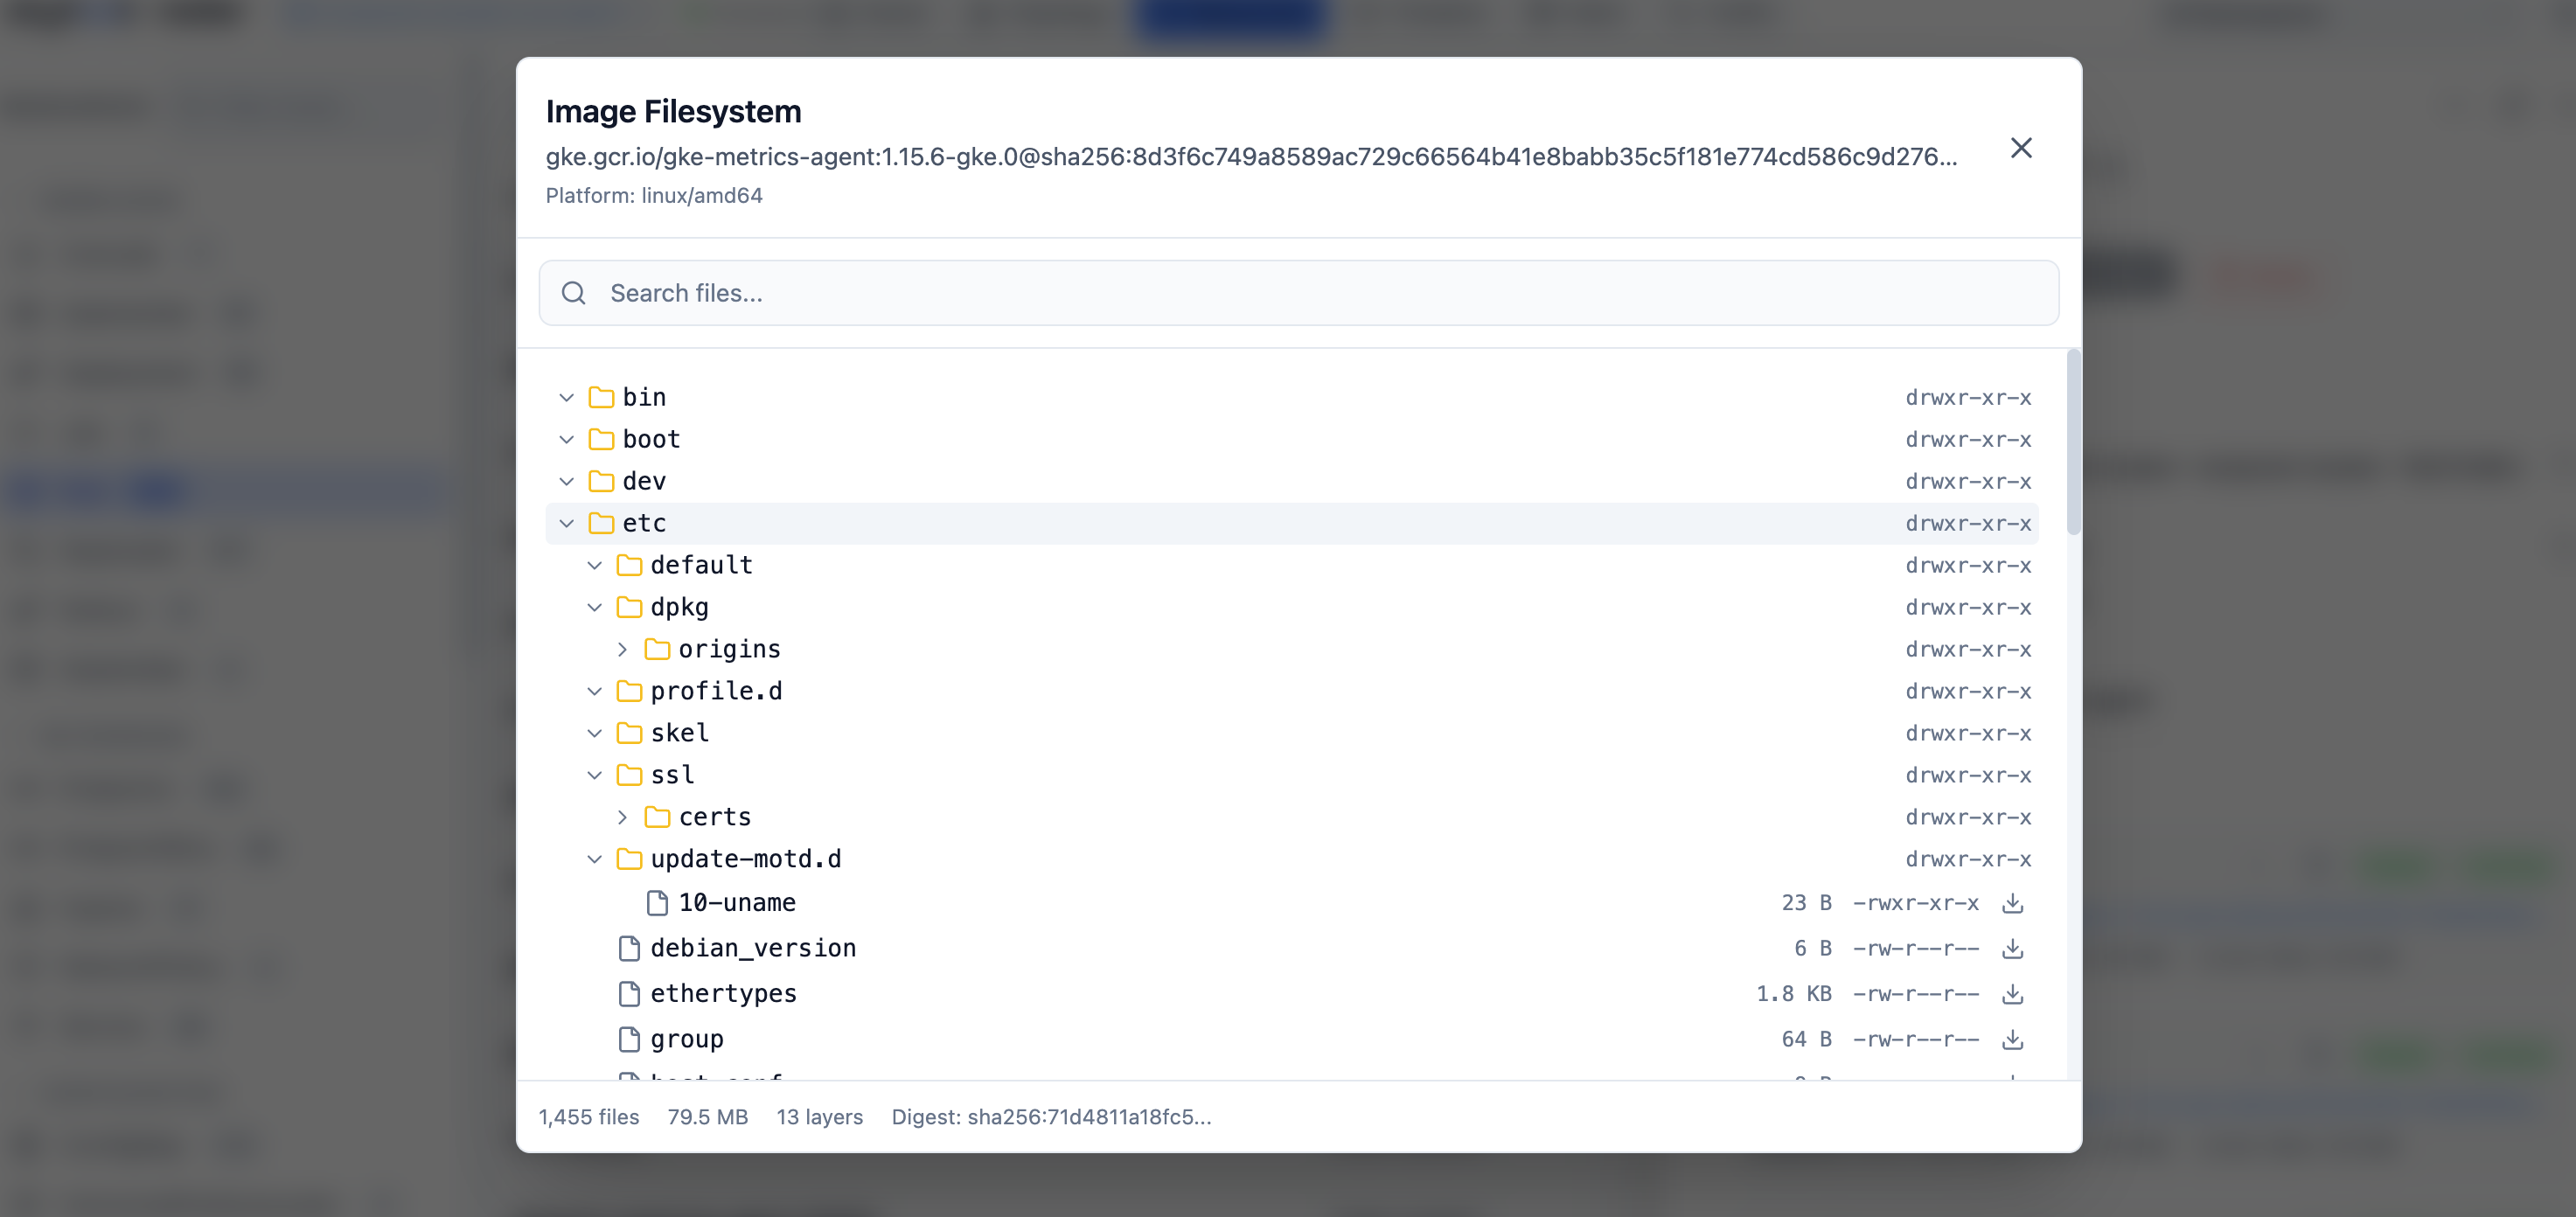
Image Filesystem Viewer — Browse container image contents
- Click any container image in a Pod to browse its complete filesystem
- Tree view with file sizes, permissions, and symlink targets
- Search files by name across the entire image
- Download individual files for inspection
- Works with public images (Docker Hub, Quay, GHCR) and private registries (GCR, ECR, ACR) using your cluster's ImagePullSecrets
- Disk-based layer caching for fast repeated access
Timeline
Unified timeline of Kubernetes events and resource changes.
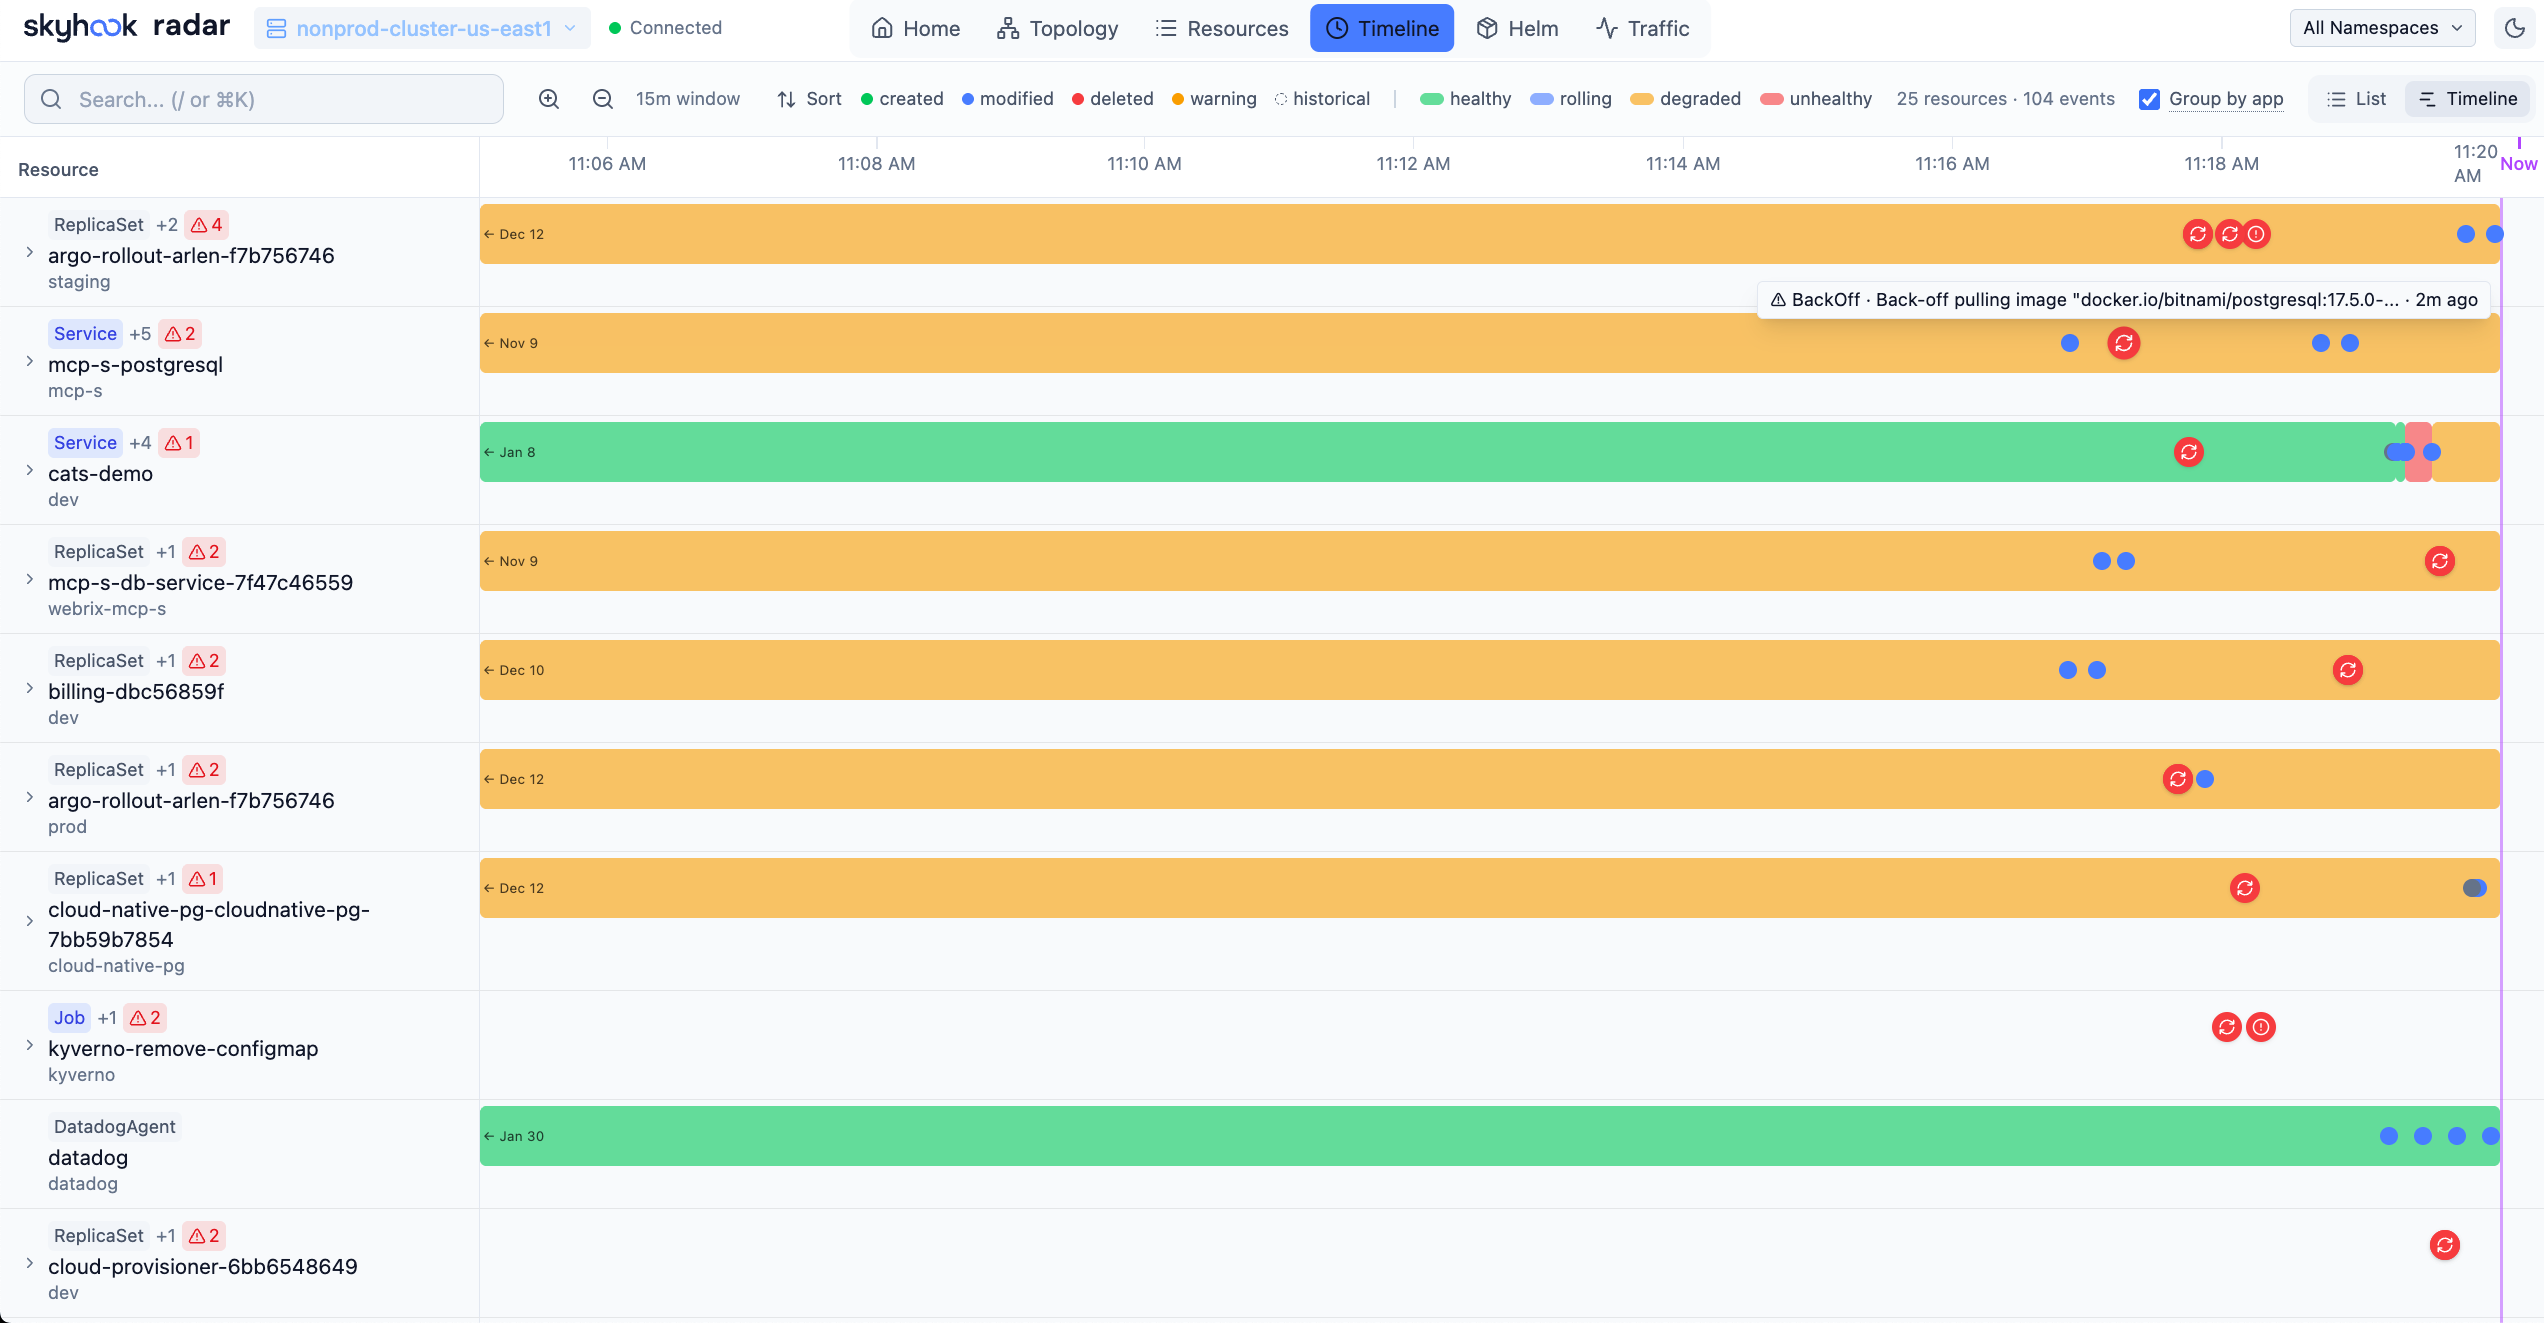
Timeline View — Track cluster activity in real-time
- Filter by event type (all or warnings only)
- Resource change diffs showing what changed (replicas, images, etc.)
- Real-time updates as new events occur
Helm
Manage Helm releases deployed in your cluster.
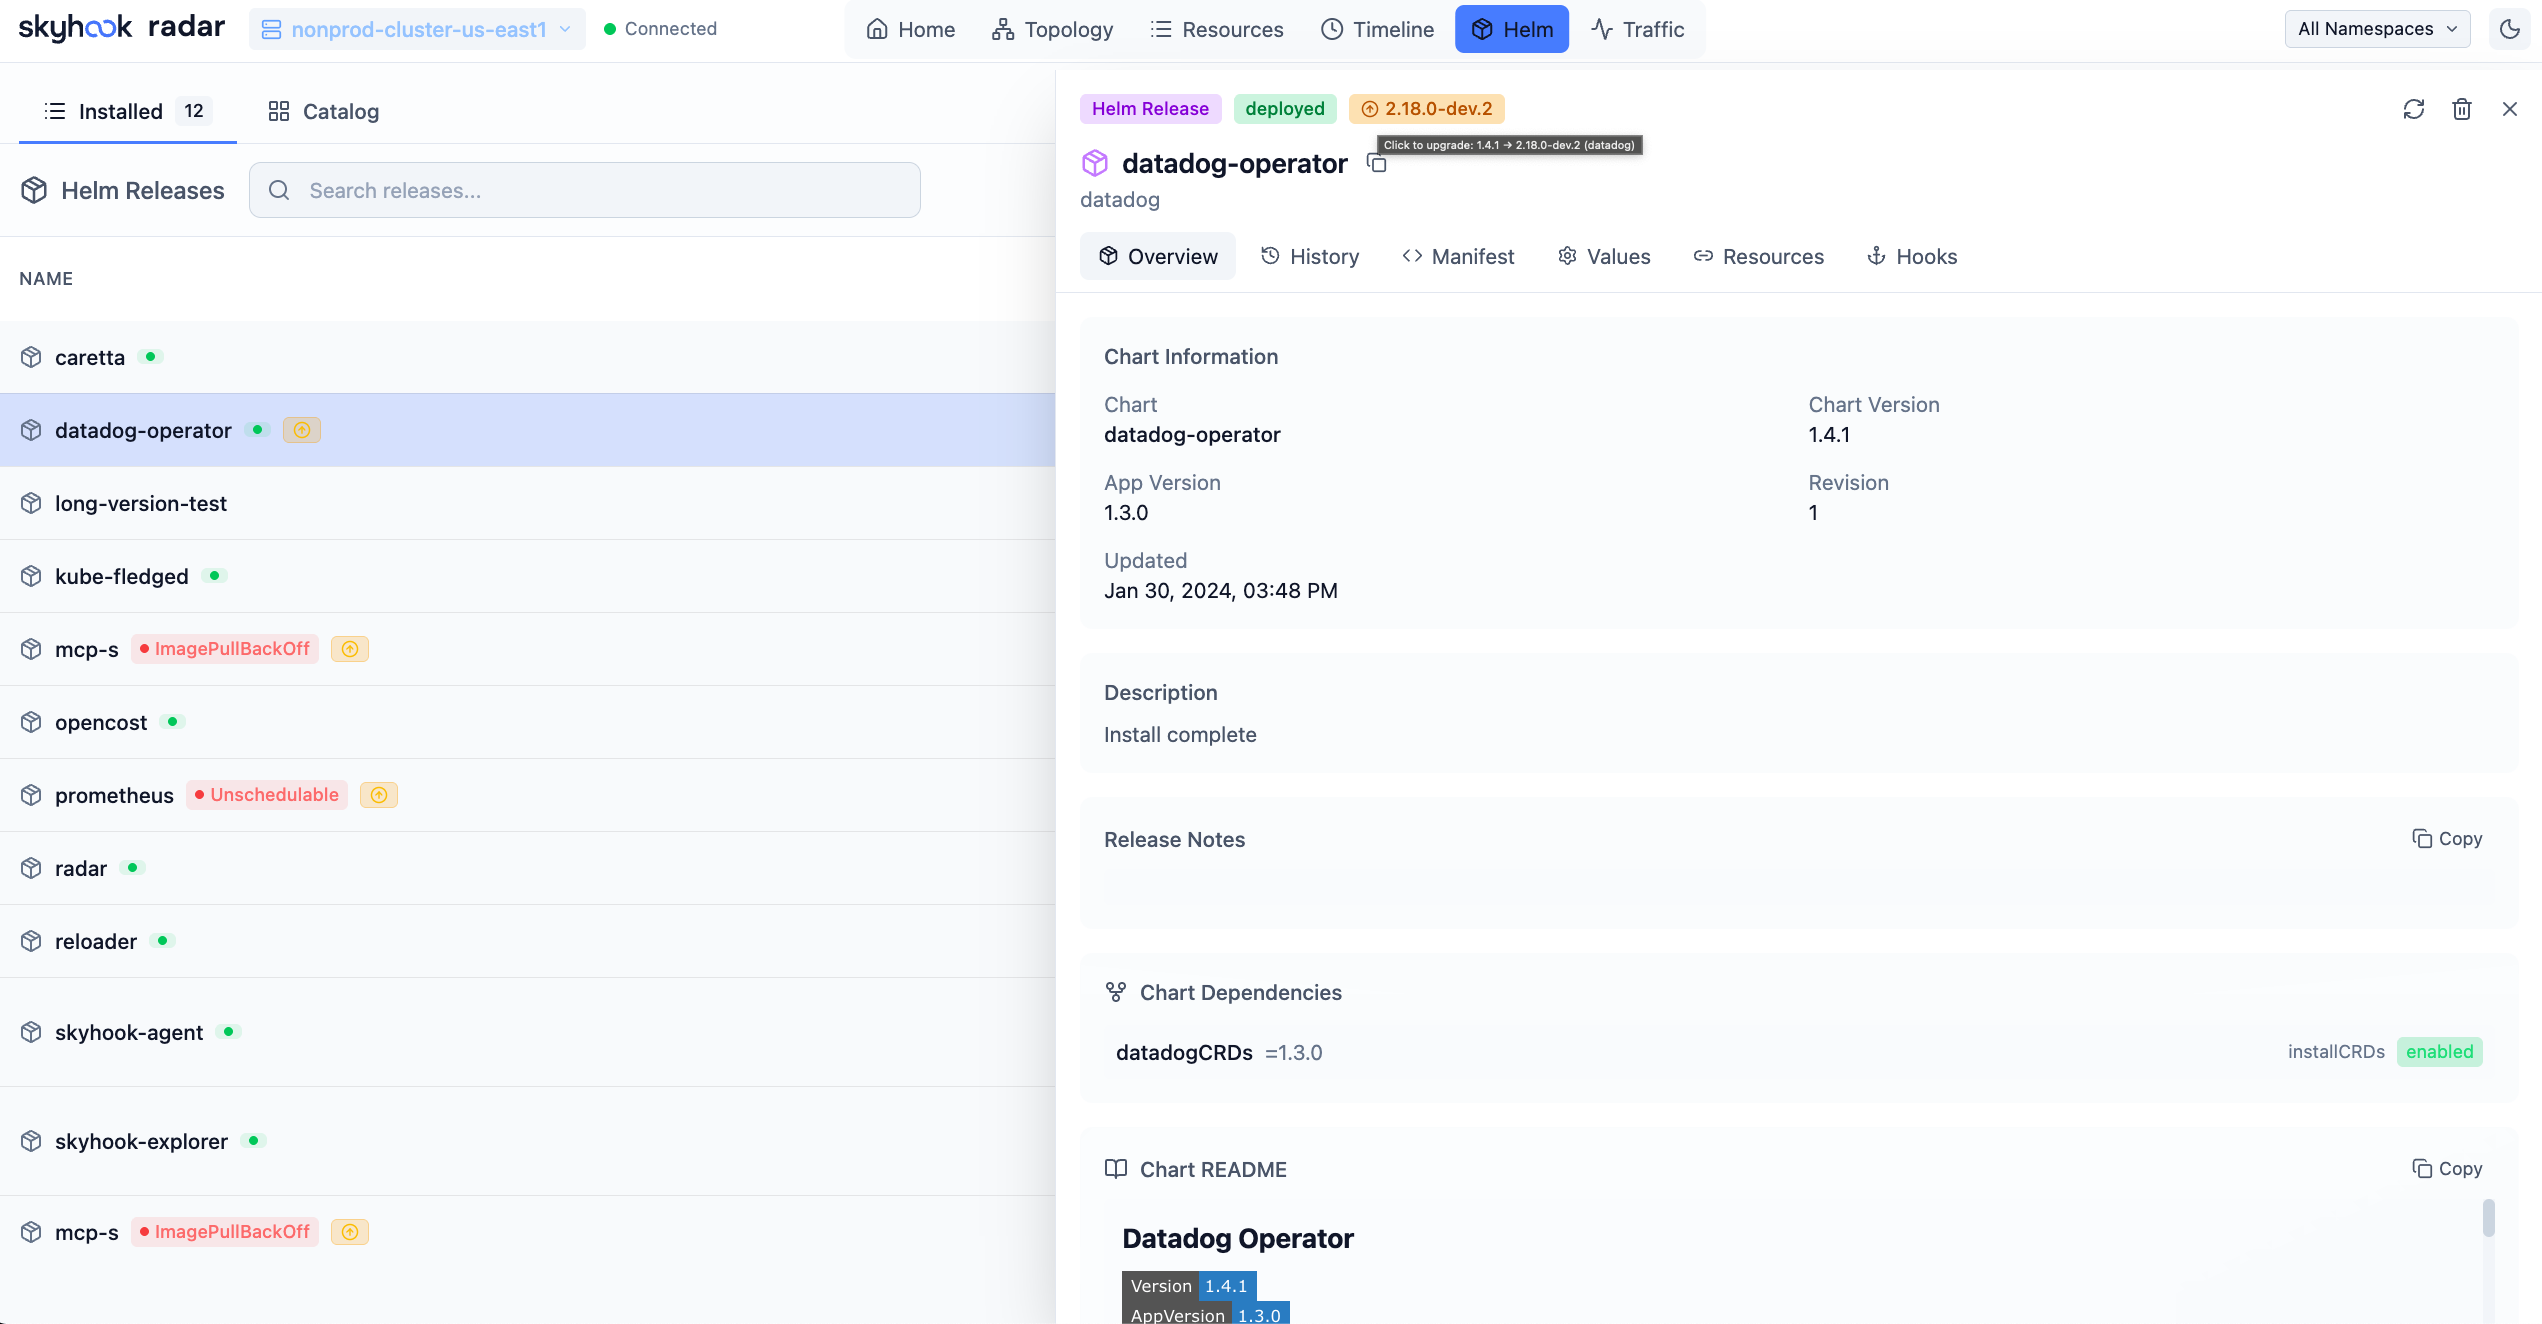
Helm View — Manage your Helm deployments
- View all releases across namespaces with status, chart version, and app version
- Inspect values, compare revisions, view release history
- Upgrade, rollback, or uninstall releases directly from the UI
Compare Resources
Diff any two Kubernetes resources of the same kind side-by-side — like comparing a staging Deployment to its production sibling, or two pods that should be identical but aren't.
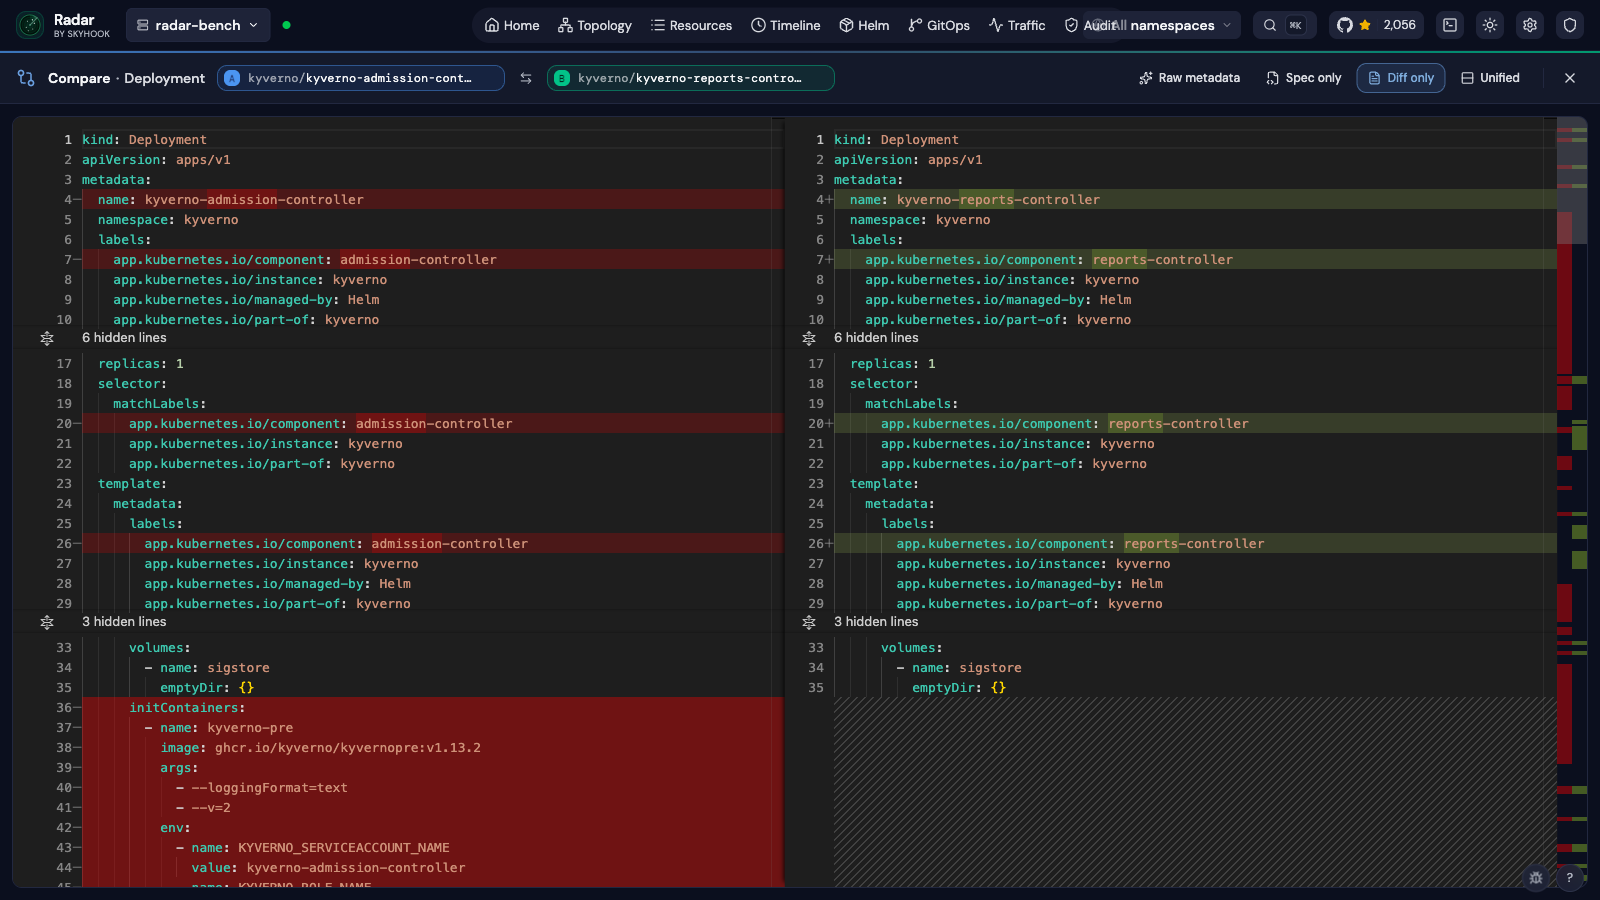
Compare View — Side-by-side YAML diff with field-level highlighting
- Two entry points: a
Comparebutton in the resource detail drawer, or compare mode in the resource table (toggle, pick two rows, hit Compare) - Side-by-side or unified view, with one-click swap of A ↔ B
- Diff-only mode collapses unchanged regions so you only see what differs
- Spec-only mode drops
statusfields to focus on intent rather than observed state - Server-assigned noise (
managedFields,resourceVersion,kubectl.kubernetes.io/last-applied-configuration) is stripped automatically so the diff stays signal — flip Raw metadata on if you actually want to see it - Same-namespace candidates are surfaced first in the picker — usually the resource you want to compare against
- Shareable URLs:
/compare?kind=&apiGroup=&a=ns/name&b=ns/name
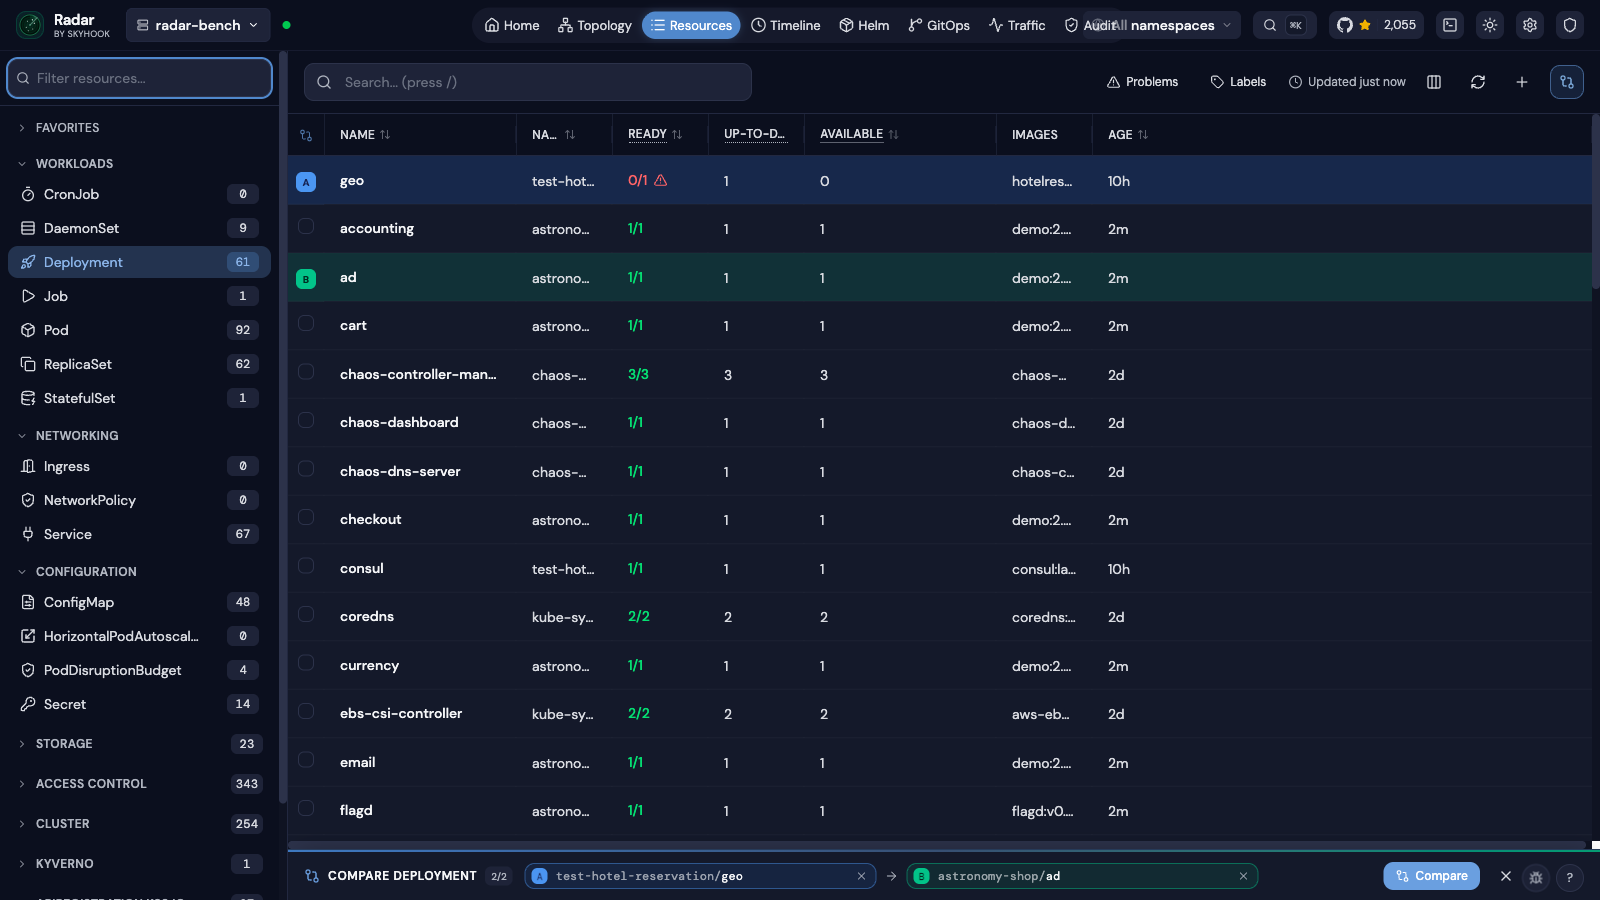
Compare mode in the resource table — pick two rows, hit Compare
TLS Certificate Management
View TLS certificate details and expiry dates across all namespaces — catch expiring certificates before they cause outages.
- Parses TLS secrets to show certificate subject, issuer, and validity period
- Dashboard-level certificate expiry overview
- Available from the resource detail view for any TLS-type Secret
GitOps
Monitor, diagnose, and manage FluxCD and ArgoCD resources from a dedicated GitOps workspace.
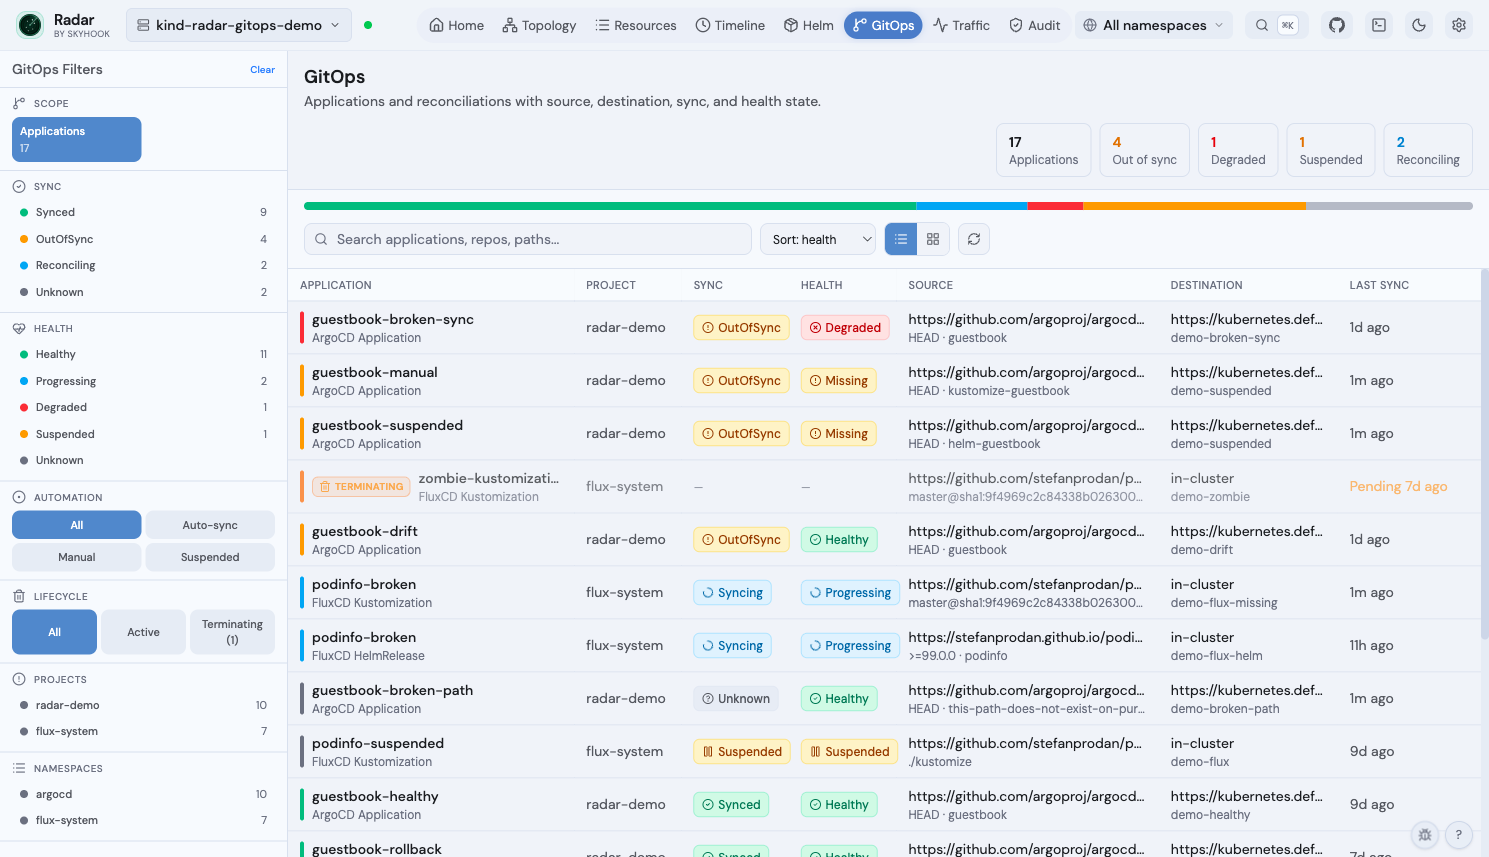
GitOps fleet view — Argo + Flux applications side-by-side with sync, health, source, destination, and lifecycle state
- Fleet view + per-app detail page (Topology / Changes / Activity tabs) for ArgoCD (
Application,ApplicationSet,AppProject) and FluxCD (GitRepository,OCIRepository,HelmRepository,Bucket,Kustomization,HelmRelease,Alert) - Diagnosis pipeline — field-level drift, recent events per resource, stuck-drift-loop detection, parsed operation-failures, structured one-click remediation
- Lifecycle awareness —
Terminatingchip replaces stale Sync/Health badges; severity ramps with deletion age; mutating ops refuse on zombies - Cross-linked from the rest of Radar —
Managed bychip in resource drawers, GitOps routing from Topology + Timeline + Helm view,Consumed bypanel on Flux source CRs - MCP integration —
manage_gitopsexposes sync / suspend / resume / reconcile / rollback with lifecycle-aware refusal
See the GitOps guide for the full feature matrix, RBAC requirements, demo cluster, and single-cluster scope notes.
Traffic
Visualize live network traffic between services using Hubble or Caretta.
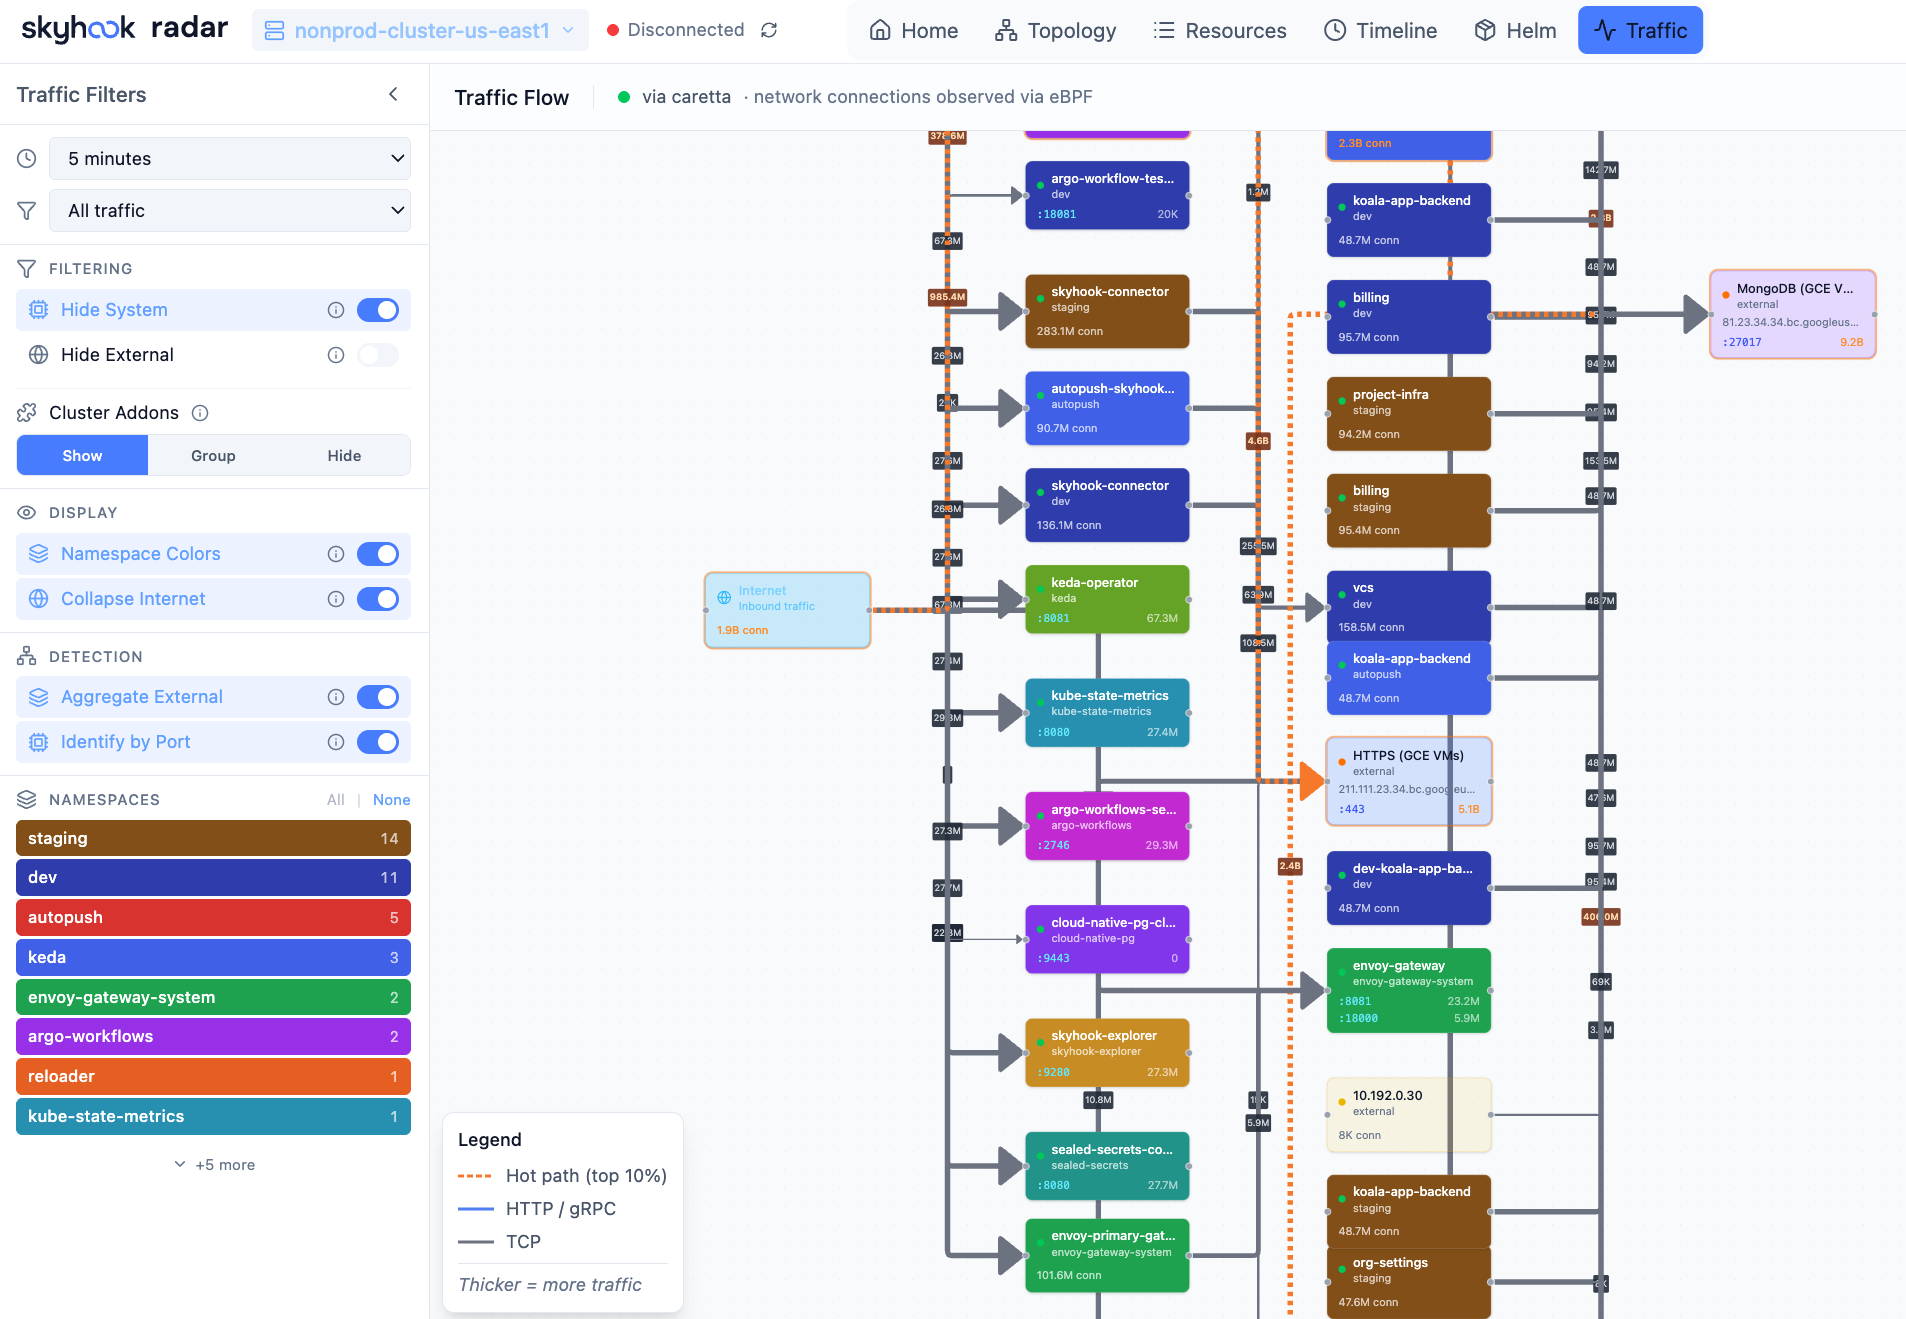
Traffic View — See how services communicate in real-time
- Auto-detects Hubble (Cilium), Caretta, or Istio as traffic data sources
- Animated flow graph showing requests per second between services
- Filter by namespace, protocol, or status code
- Setup wizard to install a traffic source if none is detected
Cost Insights
Track Kubernetes spending with OpenCost integration — no additional configuration needed.
- Cluster hourly and projected monthly cost, top namespaces by spend
- Cost trend charts with 6h/24h/7d range selector
- Namespace and workload-level cost breakdowns with efficiency scoring
- Node costs with instance type and region pricing
- Appears automatically when OpenCost metrics are detected in Prometheus
Cluster Audit
Proactive best-practices scanner with 31 checks across security, reliability, and efficiency — inspired by Polaris, Kubescape, Trivy, and NSA/CISA guidelines. Runs instantly against cached data with zero cluster-side installation.
- Security: privileged containers, privilege escalation, dangerous/insecure capabilities, host namespaces, container runtime socket mounts, sensitive host paths, secrets in ConfigMaps, auto-mounted service account tokens
- Reliability: missing probes, image tag
latest, single-replica deployments, missing PDB/topology spread, pod HA risk (all replicas on same node), orphan services/ingresses, deprecated API versions - Efficiency: missing CPU/memory requests and limits, orphan ConfigMaps/Secrets, resource utilization vs requests
- Grouped-by-resource and by-namespace views with search, category/severity/framework filters
- Each finding includes description and remediation guidance, with inline hide actions (per-check, per-category, per-namespace)
- Configurable: ignored namespaces (with wildcard patterns), disabled checks, persisted across sessions
- Framework labels: NSA/CISA, CIS benchmarks
- MCP tool (
get_cluster_audit) for AI-assisted cluster analysis
Access Control (RBAC visibility)
Inspect what any ServiceAccount can actually do — without three kubectl describe calls.
- ServiceAccount detail: direct bindings, effective permissions (per-binding and deduplicated flat view), inherited grants via implicit groups (
system:authenticated,system:serviceaccounts), and "Used by Pods" closing the loop - Pod detail: "Permissions" section showing the most-permissive rules the Pod's SA grants, plus a blast-radius alert when the SA has wildcards, cluster-admin, escalation verbs, or cluster-wide
create pods - Workload detail (Deployment / StatefulSet / DaemonSet): same Permissions section framed at the workload level — every Pod the workload spawns inherits these grants
- Namespace detail: RBAC summary with RoleBindings configured here + ClusterRoleBindings whose subjects reference this namespace
- Role / ClusterRole detail: who is bound to this role, with subject summaries inline
- RoleBinding detail: inline preview of the rules the binding grants + warnings when subjects include wide groups (
system:authenticated,system:unauthenticated,system:masters) - "My Permissions" panel: namespace-scoped live
SelfSubjectRulesReviewfor the current user — for fast "why can't I do X" debugging - MCP:
get_subject_permissionstool exposes the same data to AI assistants for "is this SA over-privileged?" / "blast radius if compromised?" queries
Considered for follow-ups, deliberately not in this pass — RBAC audit checks (wildcard / cluster-admin / orphan-binding / unused-role detection, Kubescape-aligned), a verb × resource matrix view on the SA page (rakkess-style), a "Subject Explorer" top-level page for browsing Users / Groups without a detail page today, a graph topology view of Subject → Binding → Role → Rule (rbac-tool viz style), in-UI binding edits, and a "can-i" free-form query UI. Read-only visibility ships first; we'll come back once we see how operators use the reverse-lookup.
AI Integration (MCP) beta
Radar includes a built-in Model Context Protocol (MCP) server that lets AI assistants — Claude, Cursor, Copilot, and others — query your cluster through Radar.
Instead of raw kubectl output (verbose YAML that burns through LLM context windows), your AI gets pre-processed, token-optimized data: topology graphs, health assessments, deduplicated events, and filtered logs. Read tools are strictly read-only; write tools (restart, scale, sync) are clearly annotated and non-destructive.
Enabled by default. Disable with --no-mcp. See the MCP Guide for setup instructions.
Authentication
For shared in-cluster deployments, Radar supports optional user authentication with per-user Kubernetes RBAC.
- Proxy mode — works with oauth2-proxy, Pomerium, Cloudflare Access, or any auth proxy that sets forwarded headers
- OIDC mode — built-in login via Google, Okta, Dex, Keycloak, or any OIDC provider
- Per-user namespace scoping and write authorization via K8s impersonation
- UI adapts automatically — buttons only appear if the user has RBAC permission
No auth by default (local use). See the Authentication Guide for setup.
Supported Resources
Radar auto-discovers any CRD in your cluster. Popular tools get dedicated integrations with topology edges, detail views, and AI summaries.
Default chart RBAC covers the built-in Kubernetes kinds listed below — Workloads, Networking (including NetworkPolicies and PodDisruptionBudgets), Configuration, Storage (PersistentVolumes, PersistentVolumeClaims, StorageClasses), HorizontalPodAutoscalers, ServiceAccounts, LimitRanges, ResourceQuotas, Nodes, Namespaces, and Events. RBAC objects (Roles, ClusterRoles, RoleBindings, ClusterRoleBindings) are opt-in via rbac.viewRBAC=true. CRD-based integrations (Gateway API, VerticalPodAutoscaler, ArgoCD, FluxCD, cert-manager, etc.) need both the CRD installed in your cluster and read access granted — most groups are default-on under rbac.crdGroups.<name> (e.g. gatewayApi, verticalPodAutoscaler); check values.yaml or add custom rules via rbac.additionalRules.
| Category | Resources |
|---|---|
| Workloads | Deployments, DaemonSets, StatefulSets, ReplicaSets, Pods, Jobs, CronJobs |
| Networking | Services, Ingresses, NetworkPolicies, Endpoints, EndpointSlices, PodDisruptionBudgets |
| Configuration | ConfigMaps, Secrets (names only, values hidden), LimitRanges, ResourceQuotas |
| Storage | PersistentVolumeClaims, PersistentVolumes, StorageClasses |
| Autoscaling | HorizontalPodAutoscalers, VerticalPodAutoscalers |
| Cluster | Nodes, Namespaces, ServiceAccounts, Events |
| GitOps (FluxCD) | GitRepository, OCIRepository, HelmRepository, Kustomization, HelmRelease, Alert |
| GitOps (ArgoCD) | Application, ApplicationSet, AppProject |
| Argo Rollouts | Rollout |
| Argo Workflows | Workflow, WorkflowTemplate |
| cert-manager | Certificate, CertificateRequest, Order, Challenge, Issuer, ClusterIssuer |
| Gateway API | Gateway, GatewayClass, HTTPRoute, GRPCRoute, TCPRoute, TLSRoute |
| Istio | VirtualService, DestinationRule, Gateway, ServiceEntry, PeerAuthentication, AuthorizationPolicy |
| Traefik | IngressRoute, IngressRouteTCP, IngressRouteUDP, Middleware, MiddlewareTCP, TraefikService, ServersTransport, ServersTransportTCP, TLSOption, TLSStore |
| Contour | HTTPProxy |
| Knative Serving | Service, Configuration, Revision, Route, DomainMapping |
| Knative Eventing | Broker, Trigger, EventType, Channel, InMemoryChannel, Subscription |
| Knative Sources | PingSource, ApiServerSource, ContainerSource, SinkBinding |
| Knative Flows | Sequence, Parallel |
| Knative Networking | Ingress, Certificate, ServerlessService |
| Karpenter | NodePool, NodeClaim (+ provider-specific NodeClasses via auto-discovery) |
| KEDA | ScaledObject, ScaledJob, TriggerAuthentication, ClusterTriggerAuthentication |
| Prometheus Operator | ServiceMonitor, PodMonitor, PrometheusRule, Alertmanager |
| Security (Trivy) | VulnerabilityReport, ConfigAuditReport, ExposedSecretReport, ClusterComplianceReport, SbomReport, RbacAssessmentReport, InfraAssessmentReport |
| Velero | Backup, Restore, Schedule, BackupStorageLocation, VolumeSnapshotLocation |
| External Secrets | ExternalSecret, ClusterExternalSecret, SecretStore, ClusterSecretStore |
| CloudNativePG | Cluster, Backup, ScheduledBackup, Pooler |
| Crossplane | Managed Resources (any provider), Composite Resources, Claims, Provider, ProviderConfig, Function, Configuration, Composition, CompositionRevision, XRD |
| Kyverno | Policy, ClusterPolicy, PolicyReport, ClusterPolicyReport |
| Sealed Secrets | SealedSecret |
| Dynamic Resource Allocation | ResourceClaim, ResourceClaimTemplate, DeviceClass, ResourceSlice (resource.k8s.io, K8s 1.32+) |
| NVIDIA GPU Operator | ClusterPolicy, NVIDIADriver |
| Cost (OpenCost) | Namespace/workload/node cost breakdown via Prometheus (no CRDs) |
| CRDs | Any Custom Resource Definition in your cluster (auto-discovered) |
Keyboard Shortcuts
| Shortcut | Action |
|---|---|
1–6 | Switch view (Home, Topology, Resources, Timeline, Helm, Traffic) |
t | Toggle dark/light theme |
? | Show keyboard shortcuts |
⌘K | Open command palette |
/ | Focus search (context-aware) |
f | Fit topology to screen |
+ / - / 0 | Zoom in / out / reset (topology) |
j / k | Navigate rows (resources, helm) |
g g / G | Jump to first / last row |
Enter / d | Open selected resource detail |
y | Open YAML view |
l | Open logs (pods/workloads) |
[ / ] | Previous / next resource kind |
Escape | Close panel/modal/search |
Topology: Pan (drag), Zoom (scroll), Select (click), Multi-select (Shift+click)
Development
See the Development Guide for building from source, architecture details, API reference, and contributing.
Quick start:
git clone https://github.com/skyhook-io/radar.git
cd radar
make deps

# Terminal 1: Frontend with hot reload (port 9273)
make watch-frontend

# Terminal 2: Backend with hot reload (port 9280)
make watch-backend
Contributing
Contributions are welcome! Please read our Contributing Guide for details on the development workflow, pull request process, and coding standards.
About
Radar is built and maintained by Skyhook (YC W23) and is open source under Apache-2.0. The OSS version is fully featured and the recommended way to run Radar.
For teams that want hosted multi-cluster Radar with SSO and shared dashboards, we also offer Radar Cloud.
License
Apache 2.0 — see LICENSE
Open source. Free forever.
Built by Skyhook