trace-mcp
Framework-aware code intelligence server that builds a cross-language dependency graph from source code — 53 framework integrations across 68 languages, 100+ tools for navigation, impact analysis, refactoring, and session memory with up to 97% token reduction.
![]()
trace-mcp
![]()


![]()
![]()
AI agents recompute the same work. trace-mcp makes them reuse instead.
The recomputation → reuse layer for AI systems.
40–50% fewer tokens on average · up to 2× effective capacity · up to 99% less redundant processing
Based on early benchmarks across agent workflows with repeated context and dependency traversal.
AI systems don't scale because they recompute instead of reuse. Every turn, the agent re-reads the same files, re-traverses the same dependencies, and re-inflates the context window with structure it already discovered. Token bills grow. Latency grows. Reasoning quality drops. The model isn't the bottleneck — the recomputation leak is.
trace-mcp builds a framework-aware graph of your codebase once, then serves it through MCP so the agent reasons from a precomputed structure instead of brute-reading the repo. Ask "what breaks if I change this model?" — instead of 80 Grep calls and 190 file reads, the agent calls
get_change_impactonce and gets the blast radius across PHP, Vue, migrations, and DI. One tool call replaces ~42 minutes of agent exploration. 81 framework integrations across 80 languages, 170 tools.The same engine indexes markdown vaults.
[[wikilinks]]become first-class edges, frontmatter and#tagsbecome metadata, headings become nested sections.find_usagesreturns backlinks.apply_renamerewrites every link to a renamed note. One MCP for code and knowledge — no second tool to plug in.
Also ships a desktop app with a GPU graph explorer over the same index.
Why this matters
AI is bottlenecked not by models, but by recomputation. Agents treat the context window like a database — they re-read the same files, re-traverse the same dependencies, and re-inflate context every turn with structure they already computed five steps ago. Token bills, latency, and hallucinations all grow with project size instead of with task complexity.
trace-mcp closes the recomputation leak. The graph is built once, kept incrementally fresh, and served to every agent that asks — so the same work isn't paid for over and over.
- Lower cost — fewer tokens per successful answer, on average and at peak
- Lower latency — fewer sequential tool calls, fewer round-trips to the model
- Higher accuracy — less noise in context means fewer hallucinations and stronger first-response correctness
- Production stability — context that scales with project size, not against it
We started with code intelligence — the hardest, noisiest context most agents handle today — and the same engine now indexes markdown knowledge vaults (Obsidian, Logseq, plain MD) as a peer domain. Wikilinks, tags, frontmatter, and embeds become graph edges and symbol metadata; search, find_usages, get_change_impact, and apply_rename work identically over both.
What trace-mcp does for you
| You ask | trace-mcp answers | How |
|---|---|---|
| "What breaks if I change this model?" | Blast radius across languages + risk score + linked architectural decisions | get_change_impact — reverse dependency graph + decision memory |
| "Why was auth implemented this way?" | The actual decision record with reasoning and tradeoffs | query_decisions — searches the decision knowledge graph linked to code |
| "I'm starting a new task" | Optimal code subgraph + relevant past decisions + dead-end warnings | plan_turn — opening-move router with decision enrichment |
| "What did we discuss about GraphQL last month?" | Verbatim conversation fragments with file references | search_sessions — FTS5 search across all past session content |
| "Show me the request flow from URL to rendered page" | Route → Middleware → Controller → Service → View with prop mapping | get_request_flow — framework-aware edge traversal |
| "Find all untested code in this module" | Symbols classified as "unreached" or "imported but never called in tests" | get_untested_symbols — test-to-source mapping |
| "What's the impact of this API change on other services?" | Cross-subproject client calls with confidence scores | get_subproject_impact — topology graph traversal |
| "What notes link to this concept?" | Backlinks across the vault, with section + alias context | find_usages on a note:<basename> symbol |
| "What breaks if I rename this note?" | Every [[wikilink]] and [text](path.md) that references it | get_change_impact — wikilink-aware reverse graph |
Four things no other tool does:
-
Framework-aware edges — trace-mcp understands that
Inertia::render('Users/Show')connects PHP to Vue, that@Injectable()creates a DI dependency, that$user->posts()means apoststable from migrations. 58 integrations across 15 frameworks, 7 ORMs, 13 UI libraries. -
Code-linked decision memory — when you record "chose PostgreSQL for JSONB support", it's linked to
src/db/connection.ts::Pool#class. When someone runsget_change_impacton that symbol, they see the decision. MemPalace stores decisions as text; trace-mcp ties them to the dependency graph. -
Cross-session intelligence — past sessions are mined for decisions and indexed for search. When you start a new session,
get_wake_upgives you orientation in ~300 tokens;plan_turnshows relevant past decisions for your task;get_session_resumecarries over structural context from previous sessions. -
Code and knowledge in one graph — point trace-mcp at a markdown vault (Obsidian, Logseq, plain MD) and the same engine indexes it: each note becomes a
note:<basename>symbol, headings become nested sections,[[wikilinks]]and![[embeds]]become graph edges, frontmatter and#tagsride on metadata. PageRank, Signal Fusion ranking, embeddings, and rename refactoring all apply unchanged. The agent does not learn a second tool — it learns one graph that happens to contain both your codebase and your second brain.
The problem
AI coding agents recompute the same work every turn — and they're framework-blind while doing it.
They re-read UserController.php, then re-read it again next turn. They don't know that Inertia::render('Users/Show', $data) connects a Laravel controller to resources/js/Pages/Users/Show.vue. They don't know that $user->posts() means the posts table defined three migrations ago. They can't trace a request from URL to rendered pixel — so they trace it again, and again, every session.
The result: 5–15× repeated reads of hot files in a single task, context windows used as scratch databases, and agents that get more expensive the bigger the project gets — instead of more capable.
The solution
trace-mcp builds a cross-language dependency graph from your source code and exposes it through the Model Context Protocol — the plugin format Claude Code, Cursor, Windsurf and other AI coding agents speak. Any MCP-compatible agent gets framework-level understanding out of the box.
| Without trace-mcp | With trace-mcp |
|---|---|
| Agent reads 15 files to understand a feature | get_task_context — optimal code subgraph in one shot |
| Agent doesn't know which Vue page a controller renders | routes_to → renders_component → uses_prop edges |
| "What breaks if I change this model?" — agent guesses | get_change_impact traverses reverse dependencies across languages |
| Schema? Agent needs a running database | Migrations parsed — schema reconstructed from code |
| Prop mismatch between PHP and Vue? Discovered in production | Detected at index time — PHP data vs. defineProps |
Desktop app
trace-mcp ships with an optional Electron desktop app (packages/app) that gives you a visual surface over the same index the MCP server uses. It manages multiple projects, wires up MCP clients, and provides a GPU-accelerated graph explorer — all without opening a terminal.
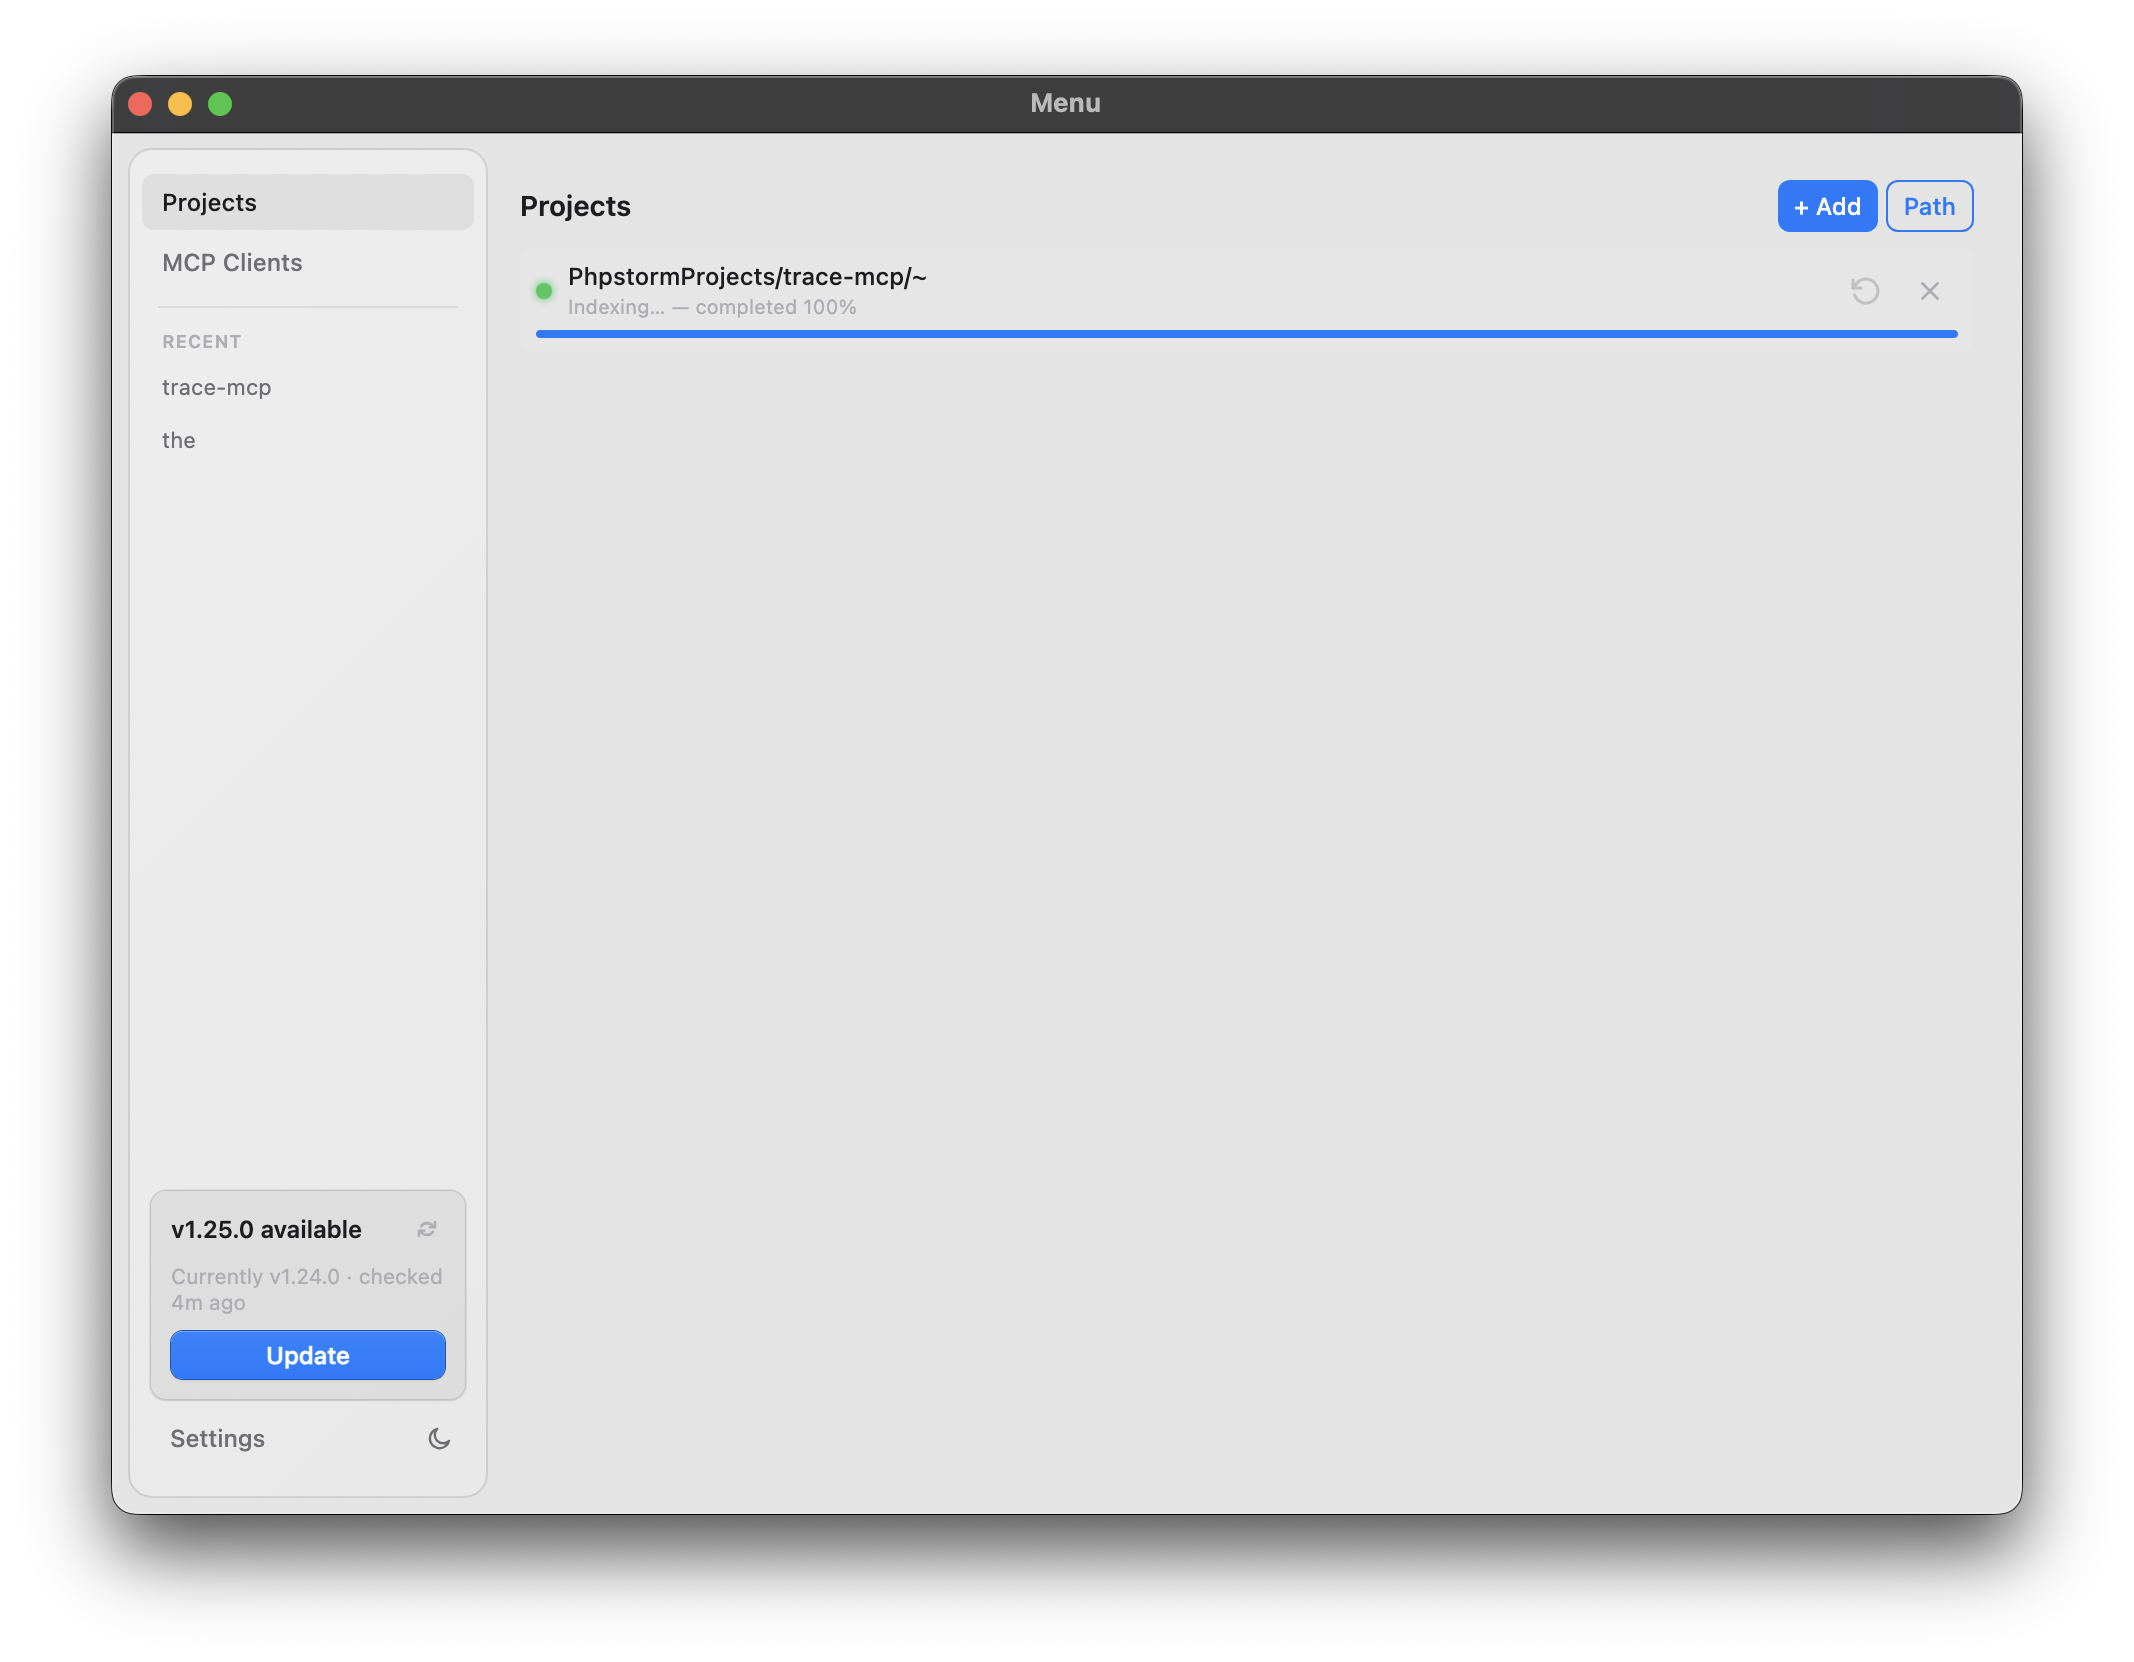
Projects & clients. The menu window lists indexed projects with live status (Ready / indexing / error) and re-index / remove controls. The MCP Clients tab detects installed clients (Claude Code, Claw Code, Claude Desktop, Cursor, Windsurf, Continue, Junie, JetBrains AI, Codex, AMP, Warp, Factory Droid) and wires trace-mcp into them with one click, including enforcement level (Base / Standard / Max — CLAUDE.md only, + hooks, + tweakcc & agent-behavior rules; Max-tier features are Claude Code–specific). Warp and JetBrains AI require manual paste in the IDE because their config storage is GUI-only.
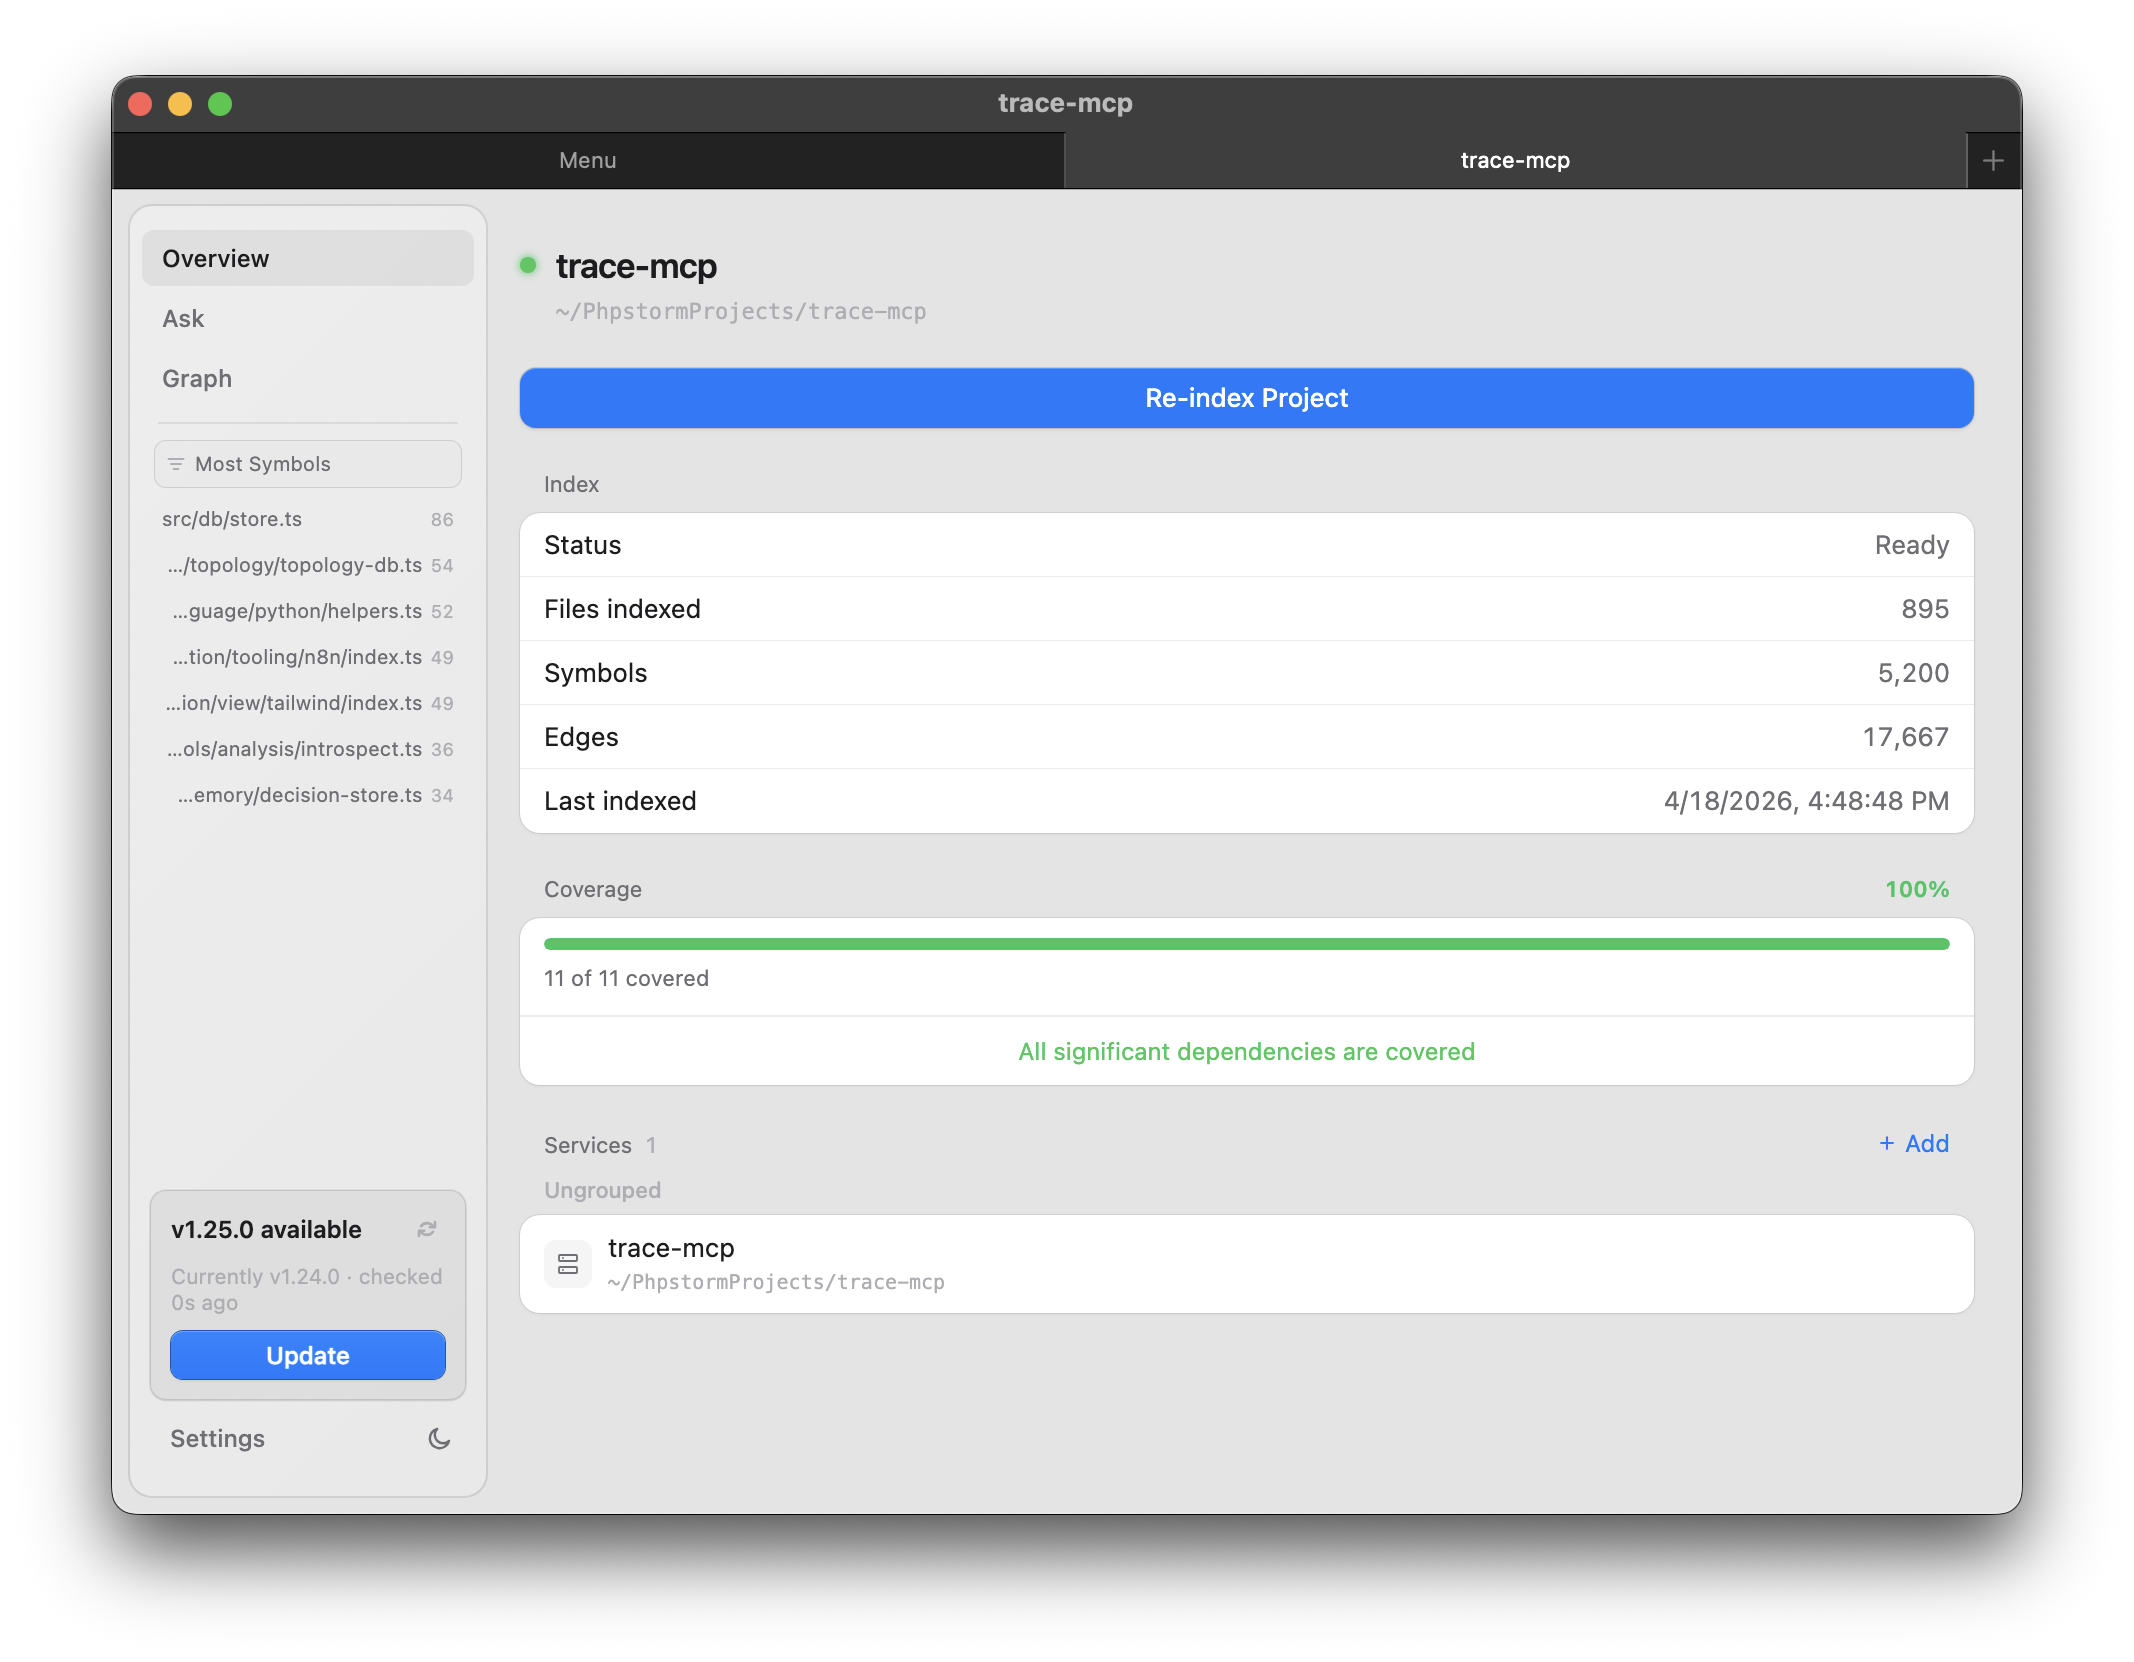
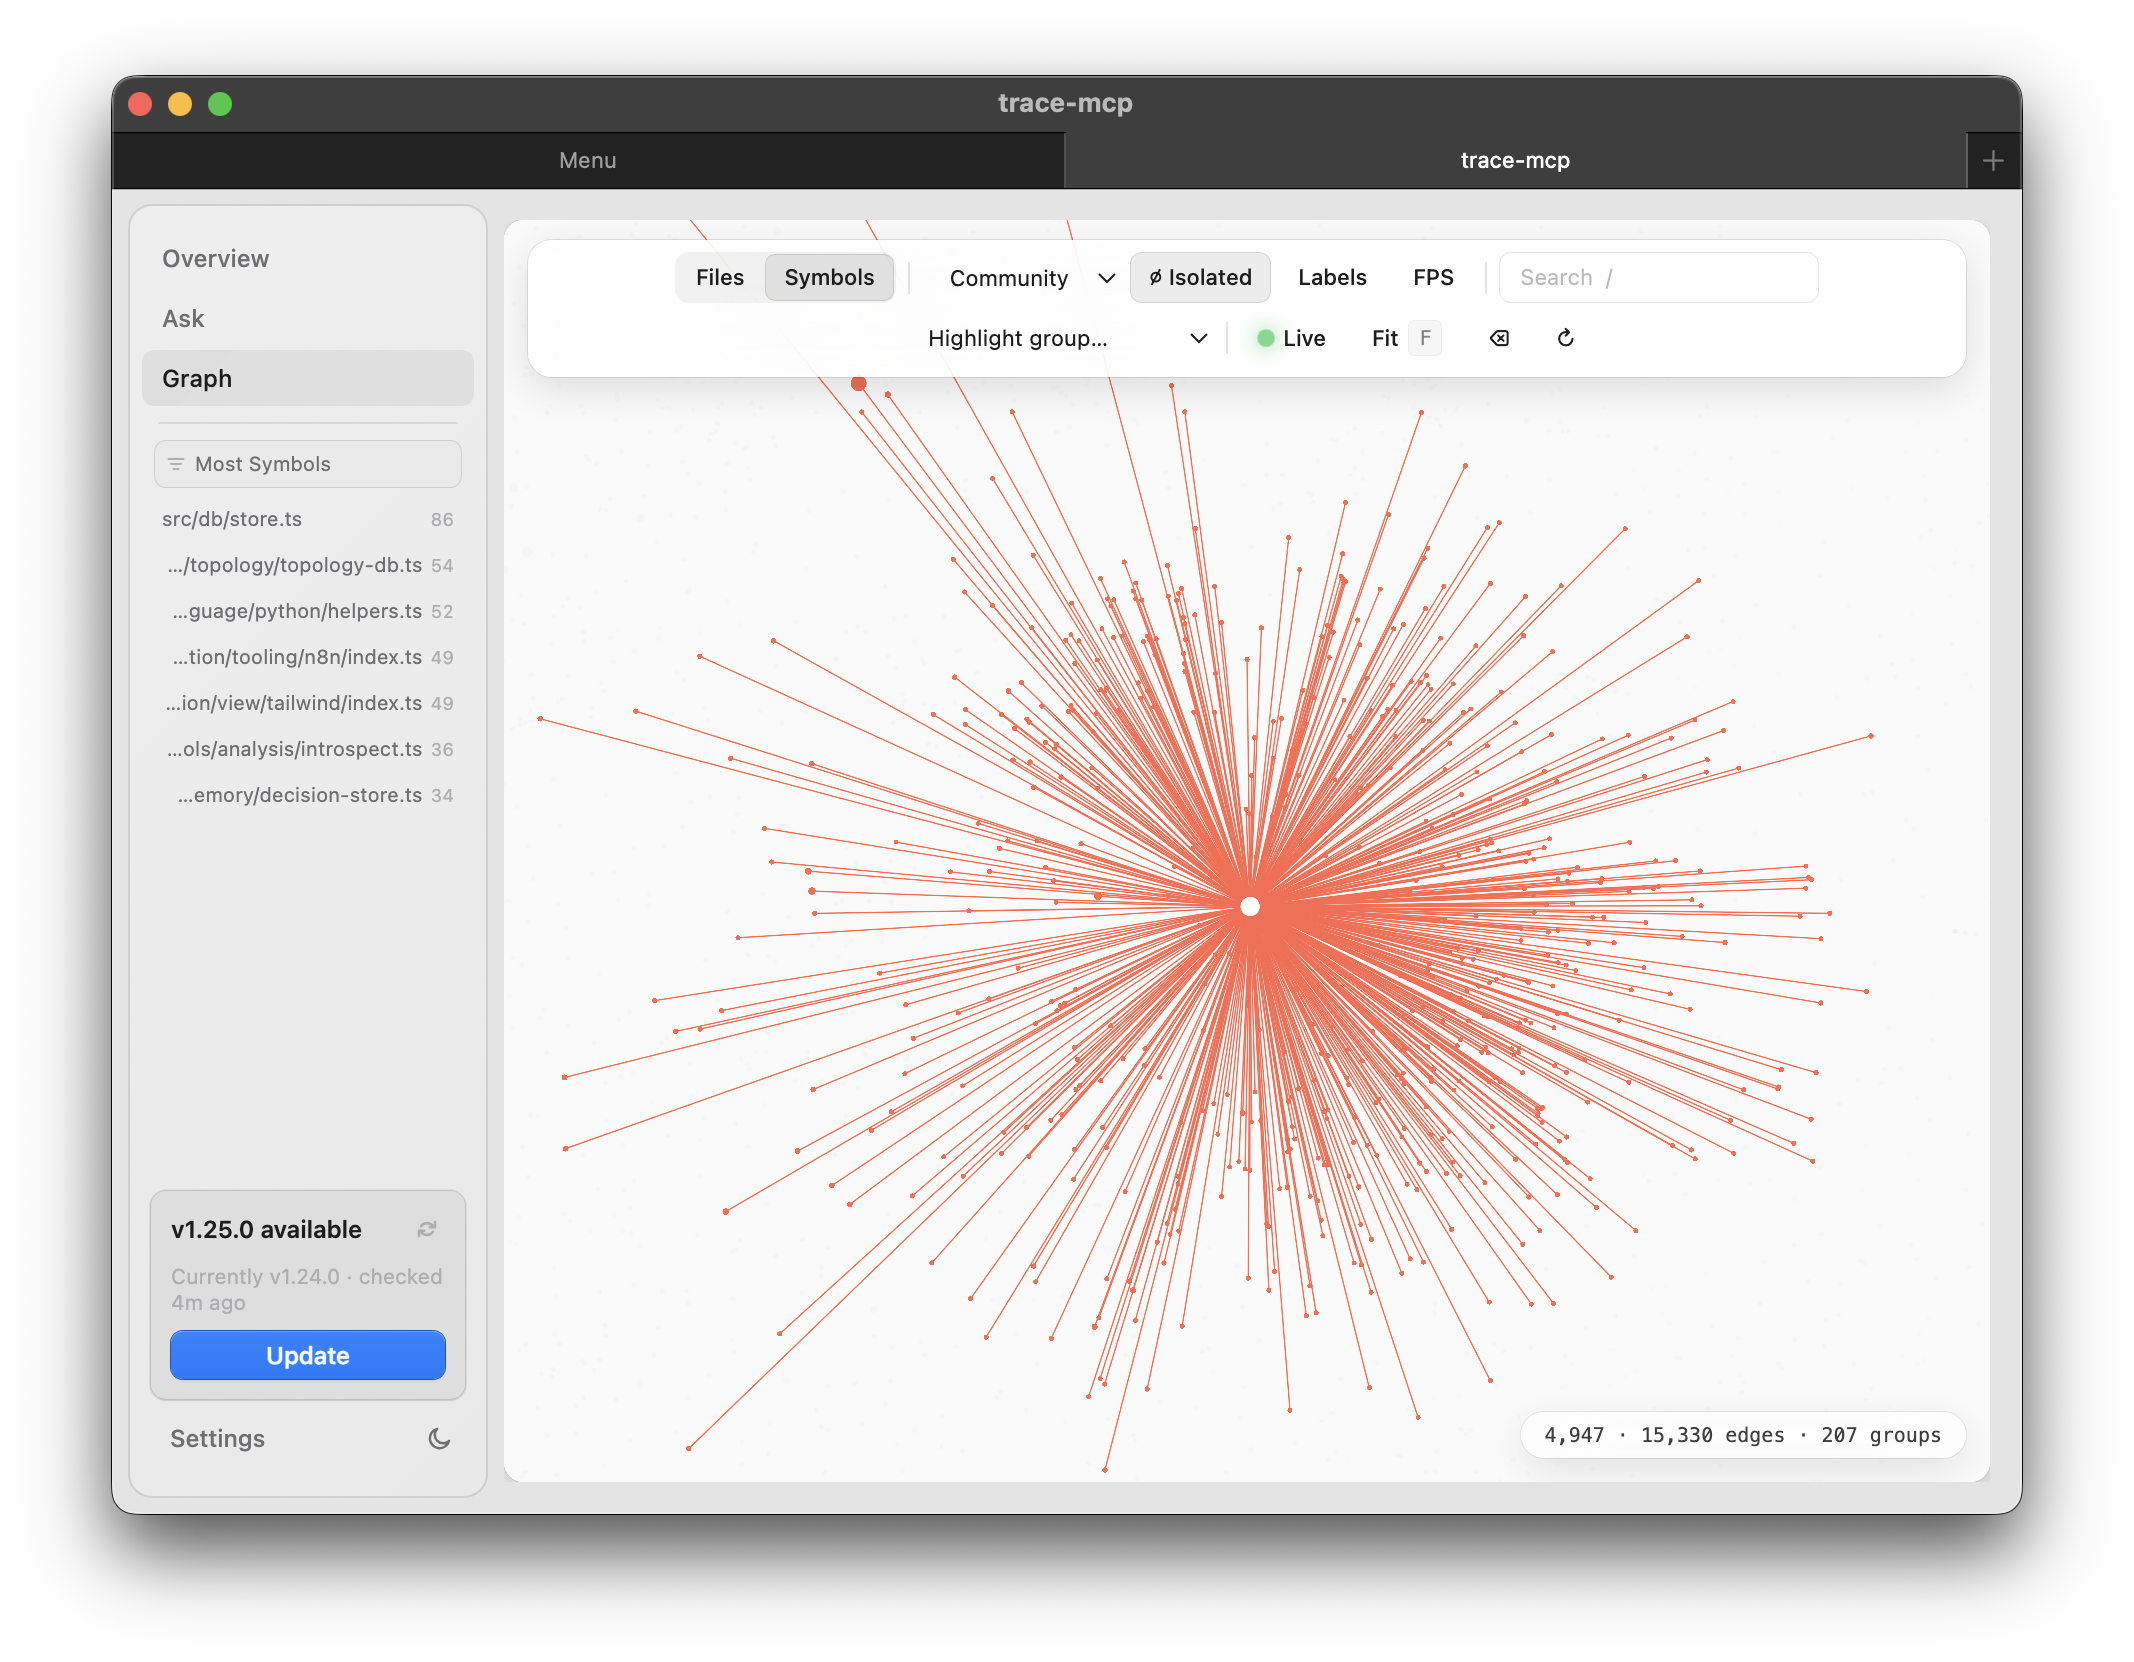
Per-project overview. Each project opens in its own tabbed window: Overview (files, symbols, edges, coverage, linked services, re-index), Ask (natural-language query over the index), and Graph. Overview also surfaces Most Symbols files, last-indexed timestamp, and the dependency coverage meter.
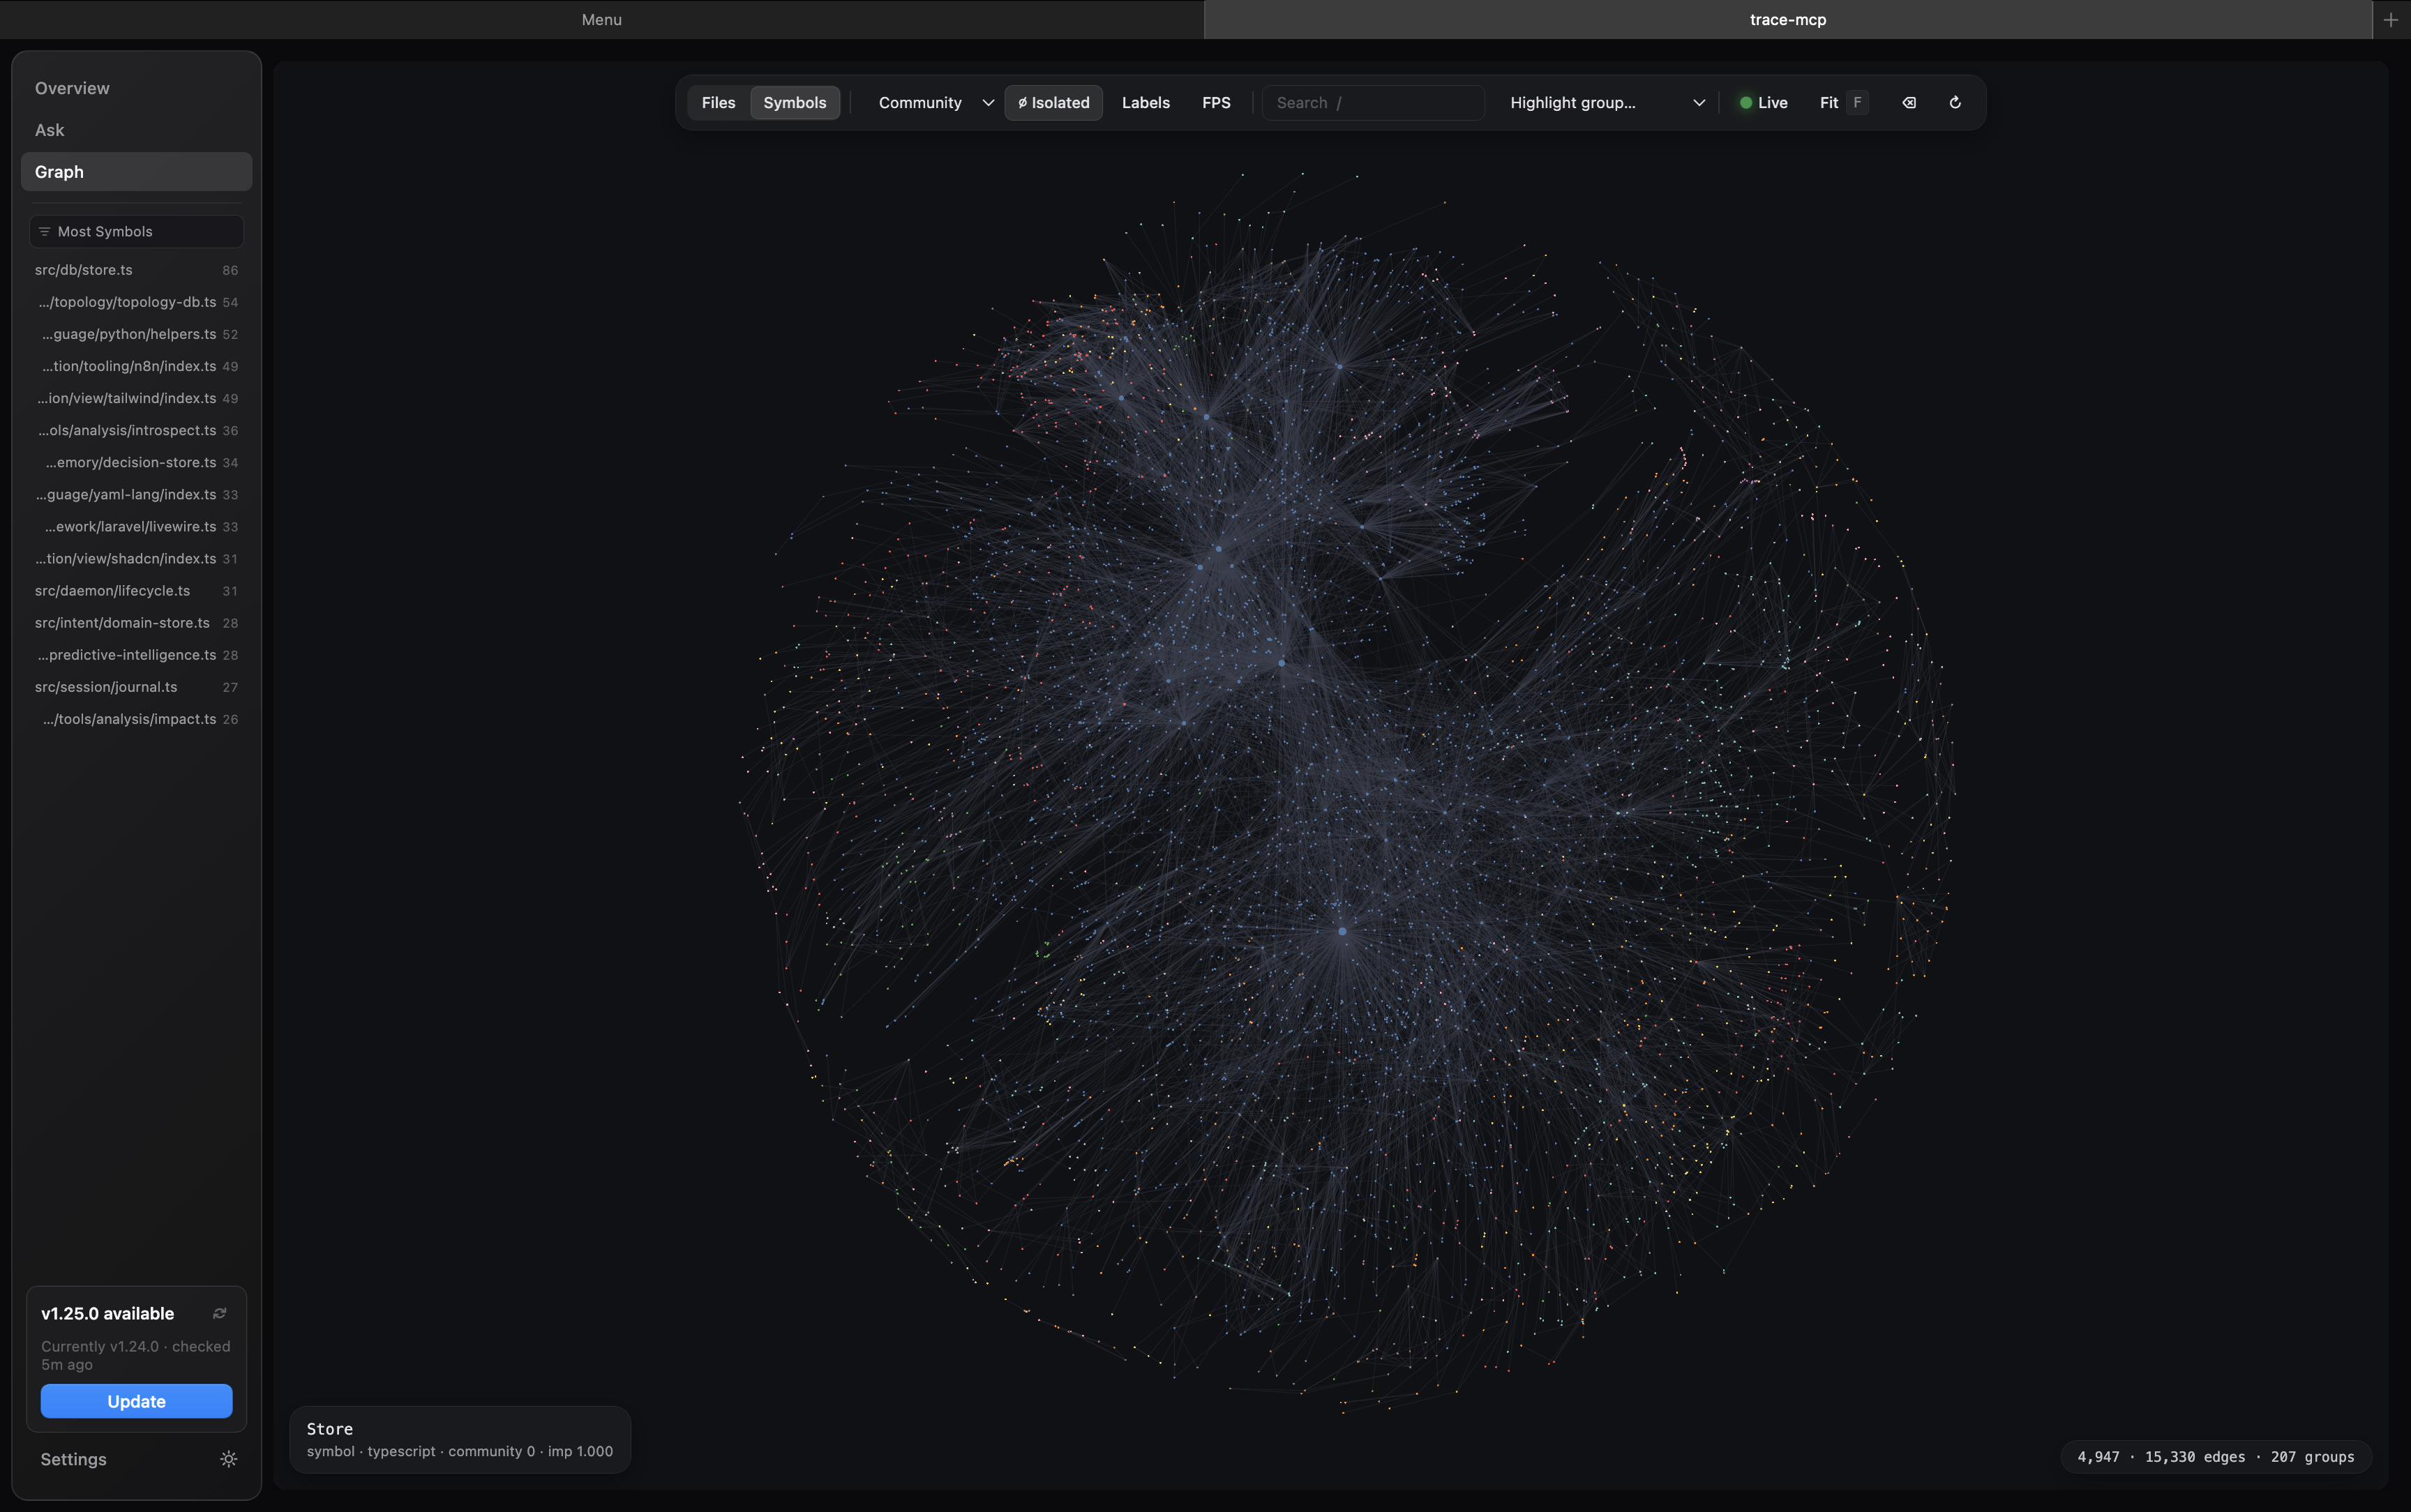
GPU graph explorer. The Graph tab renders the full dependency graph on the GPU via cosmos.gl — tens of thousands of nodes/edges at interactive frame rates. Filter by Files / Symbols, overlay detected communities, highlight groups, toggle labels/FPS, and step through graph depth. Good for getting a feel for coupling, hotspots, and how a codebase is actually shaped before you dive into tools.
Install: grab the latest build from Releases —
- macOS —
trace-mcp-<version>-arm64-mac.zip(Apple Silicon) ortrace-mcp-<version>-mac.zip(Intel). Unzip and dragtrace-mcp.appinto/Applications. - Windows — run
trace-mcp.Setup.<version>.exe.
The app talks to the same trace-mcp daemon (http://127.0.0.1:3741) that MCP clients use, so anything you index from the app is immediately available to Claude Code / Cursor / etc.
How trace-mcp compares
trace-mcp combines code graph navigation, cross-session memory, and real-time code understanding in a single tool. Most adjacent projects solve one of these — trace-mcp unifies all three and is the only one with framework-aware cross-language edges (81 integrations) and code-linked decision memory.
- vs. token-efficient exploration (Repomix, jCodeMunch, cymbal) — trace-mcp adds framework edges, refactoring, security, and subprojects on top of symbol lookup.
- vs. session-memory tools (MemPalace, claude-mem, ConPort) — trace-mcp links decisions to specific symbols/files, so they surface automatically in impact analysis.
- vs. RAG / doc-gen (DeepContext, smart-coding-mcp) — trace-mcp answers "show me the execution path, deps, and tests," not "find code similar to this query."
- vs. code-graph MCP servers (Serena, Roam-Code) — trace-mcp has the broadest language coverage (81) and is the only one with cross-language framework edges.
Full side-by-side tables with GitHub stars, languages, and per-capability coverage: docs/comparisons.md.
Token reduction — measured, not marketed
AI agents burn tokens recomputing what they already discovered last turn — re-reading files, re-traversing dependencies, re-inflating context. trace-mcp replaces that with precision context: only the symbols, edges, and signatures relevant to the query, served from a graph that was computed once.
What to expect — by workload:
| Workload | Typical reduction |
|---|---|
| Mixed real-world production (code-aware tasks across a typical session) | ~40–50% on average |
| Effective capacity at the same context budget | up to ~2× |
| Structured code-navigation tasks (symbol lookup, impact analysis, type hierarchy, call graph) | up to 99% less redundant processing |
| Targeted research / planning queries (composite tasks that replace ~10 sequential operations) | up to ~40× on individual calls |
| Non-code workloads (raw text, unstructured data) | Out of scope today |
The averages are the honest number to plan against: across a typical session you're mixing high-leverage graph queries with reads, edits, and cheaper calls, and the net usually lands at 30–60% depending on stack and task mix. The peaks (up to 99% on individual structured calls) are real and reproducible — that's where recomputation gets eliminated most cleanly — but they're per-call, not per-session.
Benchmark: trace-mcp's own codebase (694 files, 3,831 symbols → 929 files, 5,197 symbols in v1.30):
Task                    Without trace-mcp    With trace-mcp    Reduction
───────────────────────────────────────────────────────────────────────────
Symbol lookup                42,518 tokens       1,162 tokens       97.3%
File exploration             27,486 tokens         855 tokens       96.9%
Search                       22,860 tokens       8,000 tokens       65.0%
Find usages                  11,430 tokens       1,720 tokens       85.0%
Context bundle               12,847 tokens       3,485 tokens       72.9%
Batch overhead               16,831 tokens       8,299 tokens       50.7%
Impact analysis              49,141 tokens       1,856 tokens       96.2%
Call graph                  178,345 tokens       9,285 tokens       94.8%
Type hierarchy               94,762 tokens         855 tokens       99.1%
Tests for                    22,590 tokens       1,150 tokens       94.9%
Composite task              223,721 tokens      14,245 tokens       93.6%
───────────────────────────────────────────────────────────────────────────
Total                       702,532 tokens      50,812 tokens       92.8%
Across 11 structured task categories, recomputation drops by up to ~99% per call when the agent reuses the graph instead of re-reading files — peaks where the math gets dramatic. Read that as a peak structured-task result on a well-supported TS/Vue codebase, not a number you should expect on every project. In production, on mixed workloads, expect ~40–50% on average. Less noise in context also means fewer hallucinations and better first-response accuracy — a quality benefit you don't see in token counts.
Savings scale with project size. On a 650-file project, structured-task savings cluster around ~522K tokens per session. On a 5,000-file enterprise codebase, savings grow non-linearly — without trace-mcp, the agent reads more wrong files before finding the right one. With trace-mcp, graph traversal stays O(relevant edges), not O(total files).
Composite tasks deliver the biggest wins. A single get_task_context call replaces a chain of ~10 sequential operations (search → get_symbol × 5 → Read × 3 → Grep × 2). That's one round-trip instead of ten — fewer tokens, lower latency, and one clean answer instead of ten partial ones.
Run it on your codebase
npx trace-mcp benchmark .
Per-category token savings against your actual repo in ~5 minutes — no install, no signup, all local. Numbers above are from trace-mcp's own TypeScript/Vue codebase (929 files, 5,197 symbols) under structured benchmarks; production reduction on mixed workloads will be lower (typically 30–60% depending on stack), but the per-task patterns hold for any well-supported stack.
Methodology
Measured using benchmark_project — runs eleven real task categories (symbol lookup, file exploration, text search, find usages, context bundle, batch overhead, impact analysis, call graph traversal, type hierarchy, tests-for, composite task context) against the indexed project. "Without trace-mcp" = estimated tokens from equivalent Read/Grep/Glob operations (full file reads, grep output). "With trace-mcp" = actual tokens returned by trace-mcp tools (targeted symbols, outlines, graph results). Token counts estimated using trace-mcp's built-in savings tracker.
Reproduce it yourself:
# Via CLI (no install)
npx trace-mcp benchmark /path/to/project

# Or via MCP tool
benchmark_project  # runs against the current project
Key capabilities
- Request flow tracing — URL → Route → Middleware → Controller → Service, across backend frameworks
- Component trees — render hierarchy with props / emits / slots (Vue, React, Blade)
- Schema from migrations — no DB connection needed
- Event chains — Event → Listener → Job fan-out (Laravel, Django, NestJS, Celery, Socket.io)
- Change impact analysis — reverse dependency traversal across languages, enriched with linked architectural decisions
- Graph-aware task context — describe a dev task → get the optimal code subgraph (execution paths, tests, types) + relevant past decisions, adapted to bugfix/feature/refactor intent
- Call graph & DI tree — bidirectional call graphs with 4-tier resolution confidence, optional LSP enrichment for compiler-grade accuracy, NestJS dependency injection
- ORM model context — relationships, schema, metadata for 7 ORMs
- Dead code & test gap detection — find untested exports/symbols (with "unreached" vs "imported_not_called" classification), dead code, per-symbol test reach in impact analysis
- Security scanning — OWASP Top-10 pattern scanning and taint analysis (source→sink data flow). Exportable MCP-server security context for skill-scan
- Semantic search, offline by default — bundled ONNX embeddings work out of the box, no API keys; switch to Ollama/OpenAI for LLM-powered summarisation
- Decision memory — mine sessions for decisions, link them to symbols/files, auto-surface in impact analysis
- Multi-service subprojects — link graphs across services via API contracts; cross-service impact + service-scoped decisions
- CI/PR change impact reports — automated blast radius, risk scoring, test-gap detection, architecture violations on every PR
Supported stack
Languages (81): PHP, TypeScript, JavaScript, Python, Go, Java, Kotlin, Ruby, Rust, C, C++, C#, Swift, Objective-C, Objective-C++, Dart, Scala, Groovy, Elixir, Erlang, Haskell, Gleam, Bash, Lua, Perl, GDScript, R, Julia, Nix, SQL, PL/SQL, HCL/Terraform, Protocol Buffers, GraphQL, Prisma, Vue SFC, HTML, CSS/SCSS/SASS/LESS, XML/XUL/XSD, YAML, JSON, TOML, Assembly, Fortran, AutoHotkey, Verse, AL, Blade, EJS, Zig, OCaml, Clojure, F#, Elm, CUDA, COBOL, Verilog/SystemVerilog, GLSL, Meson, Vim Script, Common Lisp, Emacs Lisp, Dockerfile, Makefile, CMake, INI, Svelte, Markdown, MATLAB, Lean 4, FORM, Magma, Wolfram/Mathematica, Ada, Apex, D, Nim, Pascal, PowerShell, Solidity, Tcl
Frameworks: Laravel (+ Livewire, Nova, Filament, Pennant), Django (+ DRF), FastAPI, Flask, Express, NestJS, Fastify, Hono, Next.js, Nuxt, Rails, Spring, tRPC
ORMs: Eloquent, Prisma, TypeORM, Drizzle, Sequelize, Mongoose, SQLAlchemy
Frontend: Vue, React, React Native, Blade, Inertia, shadcn/ui, Nuxt UI, MUI, Ant Design, Headless UI
Other: GraphQL, Socket.io, Celery, Zustand, Pydantic, Zod, n8n, React Query/SWR, Playwright/Cypress/Jest/Vitest/Mocha
Knowledge vaults: Obsidian, Logseq, plain markdown — [[wikilinks]], ![[embeds]], [text](path.md), frontmatter (YAML), #tags, ATX headings. Each note becomes a note:<basename> symbol with sections nested inside; wikilinks resolve to references / embeds edges between notes. Mix vault and code in one project — point root at a directory that contains both and run a single find_usages across them.
Full details: Supported frameworks · All tools
Quick start
See your waste first — 5 minutes, no setup, no signup:
npx trace-mcp benchmark .
Indexes the project, runs 11 structured task benchmarks (symbol lookup, impact analysis, call graph, type hierarchy, …), and prints per-task token cost — without trace-mcp vs. with. You'll see exactly where your agent recomputes work it could reuse.
Then wire it into your AI agent:
npm install -g trace-mcp
trace-mcp init        # one-time global setup (MCP clients, hooks, CLAUDE.md)
trace-mcp add         # register current project for indexing
init— configures your MCP client (Claude Code, Cursor, Windsurf, Claude Desktop, …), installs the guard hook, adds routing rules to~/.claude/CLAUDE.md.add— detects frameworks, creates the per-project index, registers the project. Re-run in every project you want trace-mcp to understand.
All state lives in ~/.trace-mcp/ — your project directory stays clean unless you opt into .traceignore or .trace-mcp/.config.json.
Then in your MCP client:
> get_project_map to see what frameworks are detected
> get_task_context("fix the login bug") to get full execution context for a task
> get_change_impact on app/Models/User.php to see what depends on it
Indexing a markdown vault (Obsidian / Logseq / plain MD). Point trace-mcp add at the vault root — .md/.mdx/.markdown are picked up by default. Each note becomes a note:<basename> symbol, headings nest as sections, [[wikilinks]] and ![[embeds]] resolve to graph edges, frontmatter aliases: make alternate names resolvable, and #tags aggregate so every note carrying #sgr is one find_usages away.
> find_usages on note:my-concept     // backlinks across the vault
> find_usages on tag:sgr             // every note tagged #sgr
> get_change_impact on note:legacy   // what breaks if I rename or delete it
> search "schema-guided reasoning"   // PageRank + embeddings over the vault
Prefer a GUI? The desktop app handles install, indexing, MCP-client wiring, and re-indexing without touching a terminal.
Going further: adding more projects / upgrading / manual setup · semantic search (local ONNX) · indexing & file watcher · .traceignore.
Local-first by design
trace-mcp runs entirely on your machine. Your source code is never the product.
- Indexing happens locally. The MCP server is a Node process you run yourself — stdio or
http://127.0.0.1:3741. - Index lives in
~/.trace-mcp/, never inside your project and never uploaded. Your repo directory stays clean unless you opt into.traceignoreor.trace-mcp/.config.json. - Semantic search is offline by default — bundled ONNX embeddings, no API keys, no outbound calls. Switch to Ollama (local) or OpenAI (opt-in) via config.
- No telemetry. Nothing is phoned home about your code, queries, or usage.
- What your AI client sees is governed by your AI client. trace-mcp returns graph results over MCP; how Claude Code / Cursor / Codex / Windsurf forward them to a model is up to that client's privacy model.
- To wipe everything, delete
~/.trace-mcp/. That is the entire footprint.
For security-sensitive environments, review SECURITY.md before use.
Getting the most out of trace-mcp
trace-mcp works on three levels to make AI agents use its tools instead of raw file reading:
Level 1: Automatic (works out of the box)
The MCP server provides instructions and tool descriptions with routing hints that tell AI agents when to prefer trace-mcp over native Read/Grep/Glob. This works with any MCP-compatible client — no configuration needed.
Level 2: CLAUDE.md (recommended)
trace-mcp init adds a Code Navigation Policy block to ~/.claude/CLAUDE.md (or your project's CLAUDE.md) that tells the agent which trace-mcp tool to prefer over Read/Grep/Glob for each kind of task. If you skipped init, see System prompt routing for the full block and how to tune enforcement.
Level 3: Hook enforcement (Claude Code only)
For hard enforcement, trace-mcp init installs a PreToolUse guard hook that blocks Read/Grep/Glob on source files and redirects the agent to trace-mcp tools (non-code files, Read-before-Edit, and safe Bash commands pass through). Manage manually with trace-mcp setup-hooks --global / --uninstall. Details: System prompt routing.
Level 4: Max tier — system prompt rewrites + agent behavior rules
Picking Max during trace-mcp init (the default) layers on two more amplifiers:
- tweakcc system-prompt rewrites patch Claude Code's core tool descriptions so the model internalizes "use trace-mcp search" instead of "use Grep" from the start. Claude Code only.
agent_behavior: "strict"ships a compact set of discipline rules via MCP instructions — no flattery, disagree on wrong premises, never fabricate, goal-driven execution, 2-strike session hygiene, no drive-by refactors. Cross-client (Claude Code, Cursor, Codex, Windsurf) and auto-updates onnpm upgrade trace-mcpwithout re-runninginit.
This is the "make every teammate's agent behave like a senior engineer by default" setup. Tune or disable via tools.agent_behavior in ~/.trace-mcp/.config.json — see Tool exposure & agent behavior.
Decision memory
Decisions, tradeoffs, and discoveries from AI-agent conversations usually vanish when the session ends. trace-mcp captures them and links each decision to the code it's about — so when someone later runs get_change_impact on src/db/connection.ts::Pool#class, the "we chose PostgreSQL for JSONB" decision surfaces automatically.
- Mine —
mine_sessionsscans Claude Code / Claw Code JSONL logs and extracts decisions via pattern matching (0 LLM calls). Types: architecture, tech choice, bug root cause, tradeoff, convention. - Link — each decision attaches to a symbol or file; supports service-scoped decisions for subprojects.
- Surface — decisions auto-enrich
get_change_impact,plan_turn, andget_session_resume. Temporal validity (valid_from/valid_until) makes "what was true on 2025-01-15?" queries possible. - Search —
query_decisions(FTS5 + filters) for decisions;search_sessionsfor raw conversation content across all past sessions.
trace-mcp memory mine                           # extract decisions from sessions
trace-mcp memory search "GraphQL migration"     # search past conversations
trace-mcp memory timeline --file src/auth.ts    # decision history for a file
Full tool list, CLI, temporal validity, service scoping: Decision memory.
Subprojects
A subproject is any repo in your project's ecosystem — microservice, frontend, shared lib, CLI tool. trace-mcp links dependency graphs across subprojects: if service A calls an endpoint in service B, changing the endpoint in B shows up as a breaking change for A.
Discovery is automatic. On each index, trace-mcp detects subprojects (Docker Compose, flat/grouped workspaces, monolith fallback), parses API contracts (OpenAPI, GraphQL SDL, Protobuf/gRPC), scans code for HTTP client calls (fetch, axios, Http::, requests, http.Get, gRPC stubs, GraphQL ops), and links the calls to known endpoints.
cd ~/projects/my-app && trace-mcp add
# → auto-detects user-service (openapi.yaml) and order-service
# → links order-service → user-service via /api/users/{id}

trace-mcp subproject impact --endpoint=/api/users
# → [order-service] src/services/user-client.ts:42 (axios, confidence: 85%)
External subprojects can be added manually with trace-mcp subproject add --repo=... --project=.... MCP tools: get_subproject_graph, get_subproject_impact, get_subproject_clients, subproject_add_repo, subproject_sync.
Full CLI, detection modes, MCP-tool reference, topology config: Configuration — topology & subprojects.
CI/PR change impact reports
trace-mcp ci-report --base main --head HEAD produces a markdown or JSON report per pull request: summary, blast radius (depth-2 reverse dep traversal), test coverage gaps (per-symbol hasTestReach), risk analysis (30% complexity + 25% churn + 25% coupling + 20% blast radius), architecture violations (auto-detects clean / hexagonal presets), and new dead exports.
Use --fail-on high to block merges on high-risk changes. See .github/workflows/ci.yml for a ready-to-use GitHub Action that runs build → test → impact-report and posts a sticky PR comment on every push.
Pilot program — for teams running LLM in production
If you're shipping AI features in production — internal copilots, customer-facing assistants, RAG over a code or knowledge base — and you're hitting cost, latency, or quality ceilings, we'll run a focused pilot with you.
Format: 2–4 weeks. Minimal integration. One or two real production use cases — not a demo.
What we measure (before / after):
- Tokens per successful answer
- First-response accuracy (% of queries resolved without retry)
- Retries and fallback calls
- End-to-end latency
- User success rate on a fixed evaluation set
What you get: a clear, before/after report on whether context optimization moves the metrics that matter for your stack — and a path to scale usage with confidence instead of throttling it on cost.
We're not optimizing for cost reduction in isolation. We're optimizing for systems that work at scale: teams that move from unstable usage to reliable production and then grow their LLM footprint.
Get in touch: open an issue at github.com/nikolai-vysotskyi/trace-mcp/issues tagged pilot, or reach out to @nikolai-vysotskyi.
How it works
Source files (PHP, TS, Vue, Python, Go, Java, Kotlin, Ruby, HTML, CSS, Blade)
    │
    ▼
┌──────────────────────────────────────────┐
│  Pass 1 — Per-file extraction            │
│  tree-sitter → symbols                   │
│  integration plugins → routes,           │
│    components, migrations, events,       │
│    models, schemas, variants, tests      │
└────────────────────┬─────────────────────┘
                     │
                     ▼
┌──────────────────────────────────────────┐
│  Pass 2 — Cross-file resolution          │
│  PSR-4 · ES modules · Python modules    │
│  Vue components · Inertia bridge         │
│  Blade inheritance · ORM relations       │
│  → unified directed edge graph           │
└────────────────────┬─────────────────────┘
                     │
                     ▼
┌──────────────────────────────────────────┐
│  Pass 3 — LSP enrichment (opt-in)       │
│  tsserver · pyright · gopls ·           │
│  rust-analyzer → compiler-grade         │
│  call resolution, 4-tier confidence     │
└────────────────────┬─────────────────────┘
                     │
                     ▼
┌──────────────────────────────────────────┐
│  SQLite (WAL mode) + FTS5               │
│  nodes · edges · symbols · routes       │
│  + embeddings (local ONNX by default)   │
│  + optional: LLM summaries              │
└────────────────────┬─────────────────────┘
                     │
                     ▼
┌──────────────────────────────────────────┐
│  Decision Memory (decisions.db)         │
│  decisions · session chunks · FTS5      │
│  temporal validity · code linkage       │
│  auto-mined from session logs           │
└────────────────────┬─────────────────────┘
                     │
                     ▼
         MCP server (stdio or HTTP/SSE)
         170 tools · 2 resources
Incremental by default — files are content-hashed; unchanged files are skipped on re-index.
Plugin architecture — language plugins (symbol extraction) and integration plugins (semantic edges) are loaded based on project detection, organized into categories: framework, ORM, view, API, validation, state, realtime, testing, tooling.
Details: Architecture & plugin system
Documentation
| Document | Description |
|---|---|
| Supported frameworks | Complete list of languages, frameworks, ORMs, UI libraries, and what each extracts |
| Tools reference | All 170 MCP tools with descriptions and usage examples |
| Configuration | Config options, AI setup, environment variables, security settings |
| Architecture | How indexing works, plugin system, project structure, tech stack |
| Decision memory | Decision knowledge graph, session mining, cross-session search, wake-up context |
| Analytics | Session analytics, token savings tracking, optimization reports, benchmarks |
| System prompt routing | Optional tweakcc integration for maximum tool routing enforcement |
| Comparisons | Full side-by-side tables vs. other code intelligence / memory / RAG tools |
| Development | Building, testing, contributing, adding new plugins |
Star History
License
Built by Nikolai Vysotskyi
Related Servers
Alpha Vantage MCP Server
sponsorAccess financial market data: realtime & historical stock, ETF, options, forex, crypto, commodities, fundamentals, technical indicators, & more
Forge
GPU kernel optimization - 32 swarm agents turn PyTorch into fast CUDA/Triton kernels on real datacenter GPUs with up to 14x speedup
Metro MCP
A plugin-based MCP server for React Native runtime debugging, inspection, and automation. Connects to Metro bundler via Chrome DevTools Protocol — no app code changes needed for most features.
https://github.com/LastEld/AMS
AMS – Deterministic Agent Pipeline with A2A‑style Orchestration and Cryptographic Audit
Gemini CLI
Integrates with the unofficial Google Gemini CLI, allowing file access within configured directories.
MCP Github OAuth
An MCP server with built-in GitHub OAuth support, deployable on Cloudflare Workers.
MCP Server for iOS Simulator
An MCP server that enables LLMs to interact with iOS simulators through natural language commands.
MCP Talk Demo Files
A collection of demo files for MCP servers and clients, illustrating various transport protocols and server capabilities using Python.
ServeMyAPI
A personal server for securely storing and accessing API keys using the macOS Keychain.
Daimonos
MCP server for coding agents that returns structured, low-noise tool output to reduce tokens/cost.
MCP Stripe Server
Integrates with Stripe to manage payments, customers, and refunds.