Pinpoint
Click an element in your running web app or the iOS Simulator and say what should change; your coding agent (Claude Code, Cursor, Codex) gets your comment with the selector, DOM path, styles, component chain, source-file hint and a cropped screenshot. Local only, MIT.
Documentation
Pinpoint


Click an element on your local dev site, write what should change, and your coding agent gets it — with the selector, DOM path, computed styles, React/Vue component chain, source-file hint and a cropped screenshot. No screenshot files piling up in your Downloads folder, no describing "the third button on the left". Building a native app? The same works on the iOS Simulator.
It is not only for styling. Say what the thing should do — "disable this until the form is valid", "this should save the draft before closing", "show the error the API returned here" — and the agent is told to treat the element as where to start, then follow it into the handlers, state, API calls and backend behind it. More below.
Browser (extension) ──POST──▶ pinpoint bridge (127.0.0.1:7331) ──MCP / hooks──▶ Claude Code, Cursor, Codex…
        pins ◀──live events───┘   ~/.pinpoint/annotations.json   └── <repo>/.pinpoint/pending.md (optional)
iOS Simulator ─▶ 127.0.0.1:7331/ios ─┘  (screenshot + accessibility tree instead of the DOM)
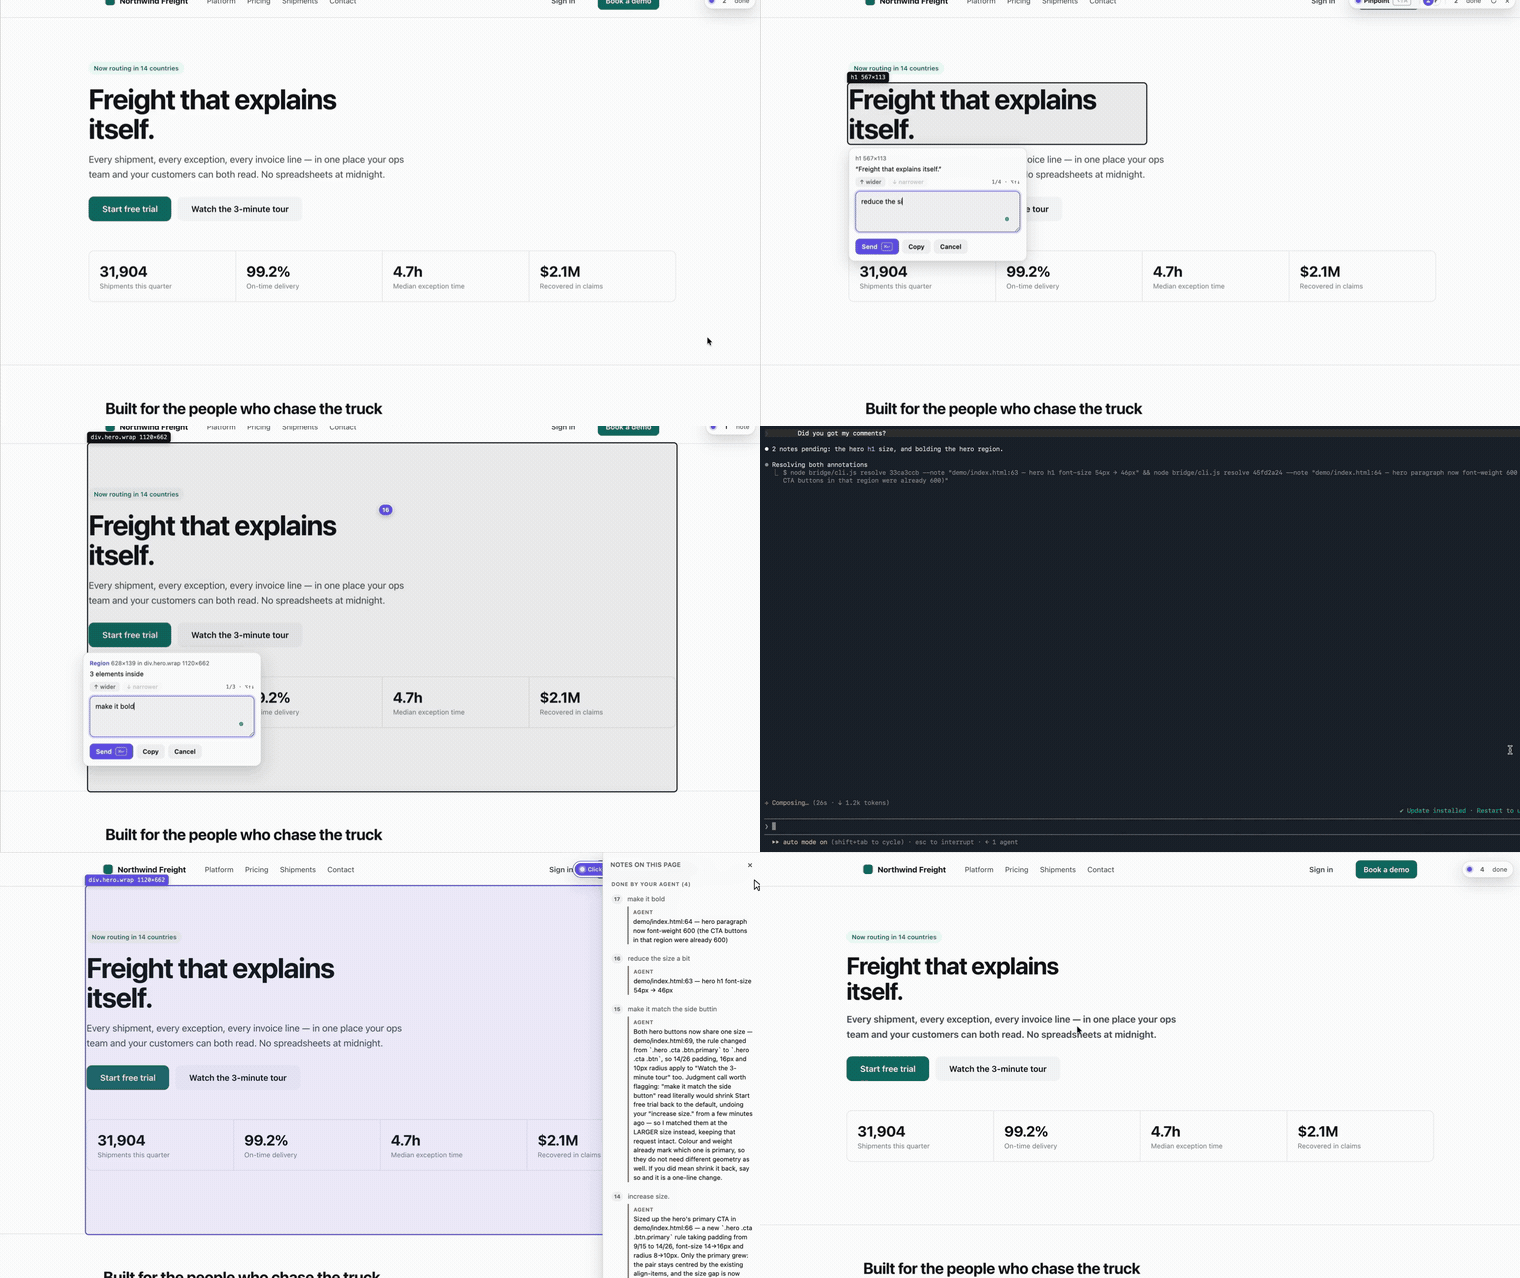
Click an element, say what should change, your agent gets it. (full-speed video)
It is not a browser-driving agent
The distinction matters, because the two get filed together and they are opposites:
- Playwright MCP, agent-browser, computer-use put the agent in the driver's seat — it navigates, clicks and asserts. Good for testing and for browsing on your behalf.
- Pinpoint keeps you in it. You click, you say what should change, and the agent gets structured context to edit code with: a selector, the styles, the component chain, a source-file hint, a crop of the element. It never touches the page itself.
- A pasted screenshot carries none of that. The agent gets pixels and has to guess which control you meant, what it is called, and where it lives in the tree.
So it composes with browser automation rather than competing: point at the thing, let the agent change it, let your tests drive the browser.
Quick start
You need Node 18+ and a Chromium browser (Chrome, Edge, Brave, Arc, Opera, Vivaldi).
git clone https://github.com/gowtham012/pinpoint
node pinpoint/bridge/cli.js setup
That is the install. setup installs its own dependencies first, then asks — every question has a
default, so Enter all the way through is a working setup:
- which project's UI you want to annotate — the repo whose files your agent will be editing
- whether it is a web app or a native iOS app (or both) — web gets the browser extension; iOS gets the Simulator picker, and setup checks for Xcode, Maestro and Java and says how to get whichever is missing. It installs none of them for you.
- which agents to wire up — it detects Claude Code, Cursor and Codex and writes the MCP entry for
each:
claude mcp addfor Claude Code,<project>/.cursor/mcp.jsonfor Cursor,~/.codex/config.tomlfor Codex. Existing entries are merged, never replaced, and the TOML file is backed up before it is touched. - whether to install the Claude Code hooks, which carry pending notes in with your next message
- which browser to load the extension into, listing the ones you actually have (web only)
Then it registers the launcher behind the popup's Start bridge button and starts the bridge.
Non-interactive, for a scripted machine: node pinpoint/bridge/cli.js setup ~/code/my-app --yes
(add --for ios or --for both; the default is web).
Building only a native iOS app? You can skip the clone: the iOS picker needs no extension.
npx -y pinpoint-bridge                                      # the bridge, with the picker at /ios
claude mcp add pinpoint -s user -- npx -y pinpoint-bridge mcp   # once, for Claude Code
Pinpoint is also listed in the official MCP Registry
(io.github.gowtham012/pinpoint), on cursor.directory
(one-click Add to Cursor) and on Glama. All
of them install the MCP server only — for web pages you still need the extension and bridge from the
clone above.
The one step that cannot be a command. Chrome does not let a terminal load an unpacked extension
into your own profile — only the Web Store or an enterprise policy can. So setup opens your browser's
extensions page and puts the extension/ folder on your clipboard: Developer mode on →
Load unpacked → paste. The terminal confirms ✓ Pinpoint is live in Chrome on its own, because
the bridge can see the extension connect.
Restart Claude Code once afterwards — it reads MCP servers and hooks when a session starts.
Then try it. Open your dev site (or the demo page), press ⌥⇧A / Alt+Shift+A, click any element, type what should change, ⌘↩ / Ctrl+Enter. Type anything at all in Claude Code and your note arrives with it. If the bar never appears, see Troubleshooting.
Doing it by hand instead, and the Windows / file:// notes
setup writes config into your repo and your agent's files. If you would rather do that yourself,
it is four steps — and the order matters: $PWD is baked into the MCP entry, so step 2 has to run
from pinpoint/bridge, before the bridge takes over the terminal.
# 1. get it
git clone https://github.com/gowtham012/pinpoint
cd pinpoint/bridge && npm install

# 2. wire up Claude Code (once, from this folder)
claude mcp add pinpoint -s user -- node "$PWD/cli.js" mcp
node cli.js install-hooks ~/code/my-app                  # notes arrive without being asked
node cli.js install-native-host --project ~/code/my-app   # optional: the popup's "Start bridge" button

# 3. load extension/ unpacked at chrome://extensions (Developer mode on)
# 4. start the bridge, and leave it running
node cli.js --project ~/code/my-app
Restart Claude Code once after step 2. --project is optional: it keeps
<repo>/.pinpoint/pending.md current for agents that read a file instead of MCP.
Annotating a page you opened as a file:// URL? Chrome keeps that off by default. On
chrome://extensions, open Pinpoint's Details and turn on "Allow access to file URLs", then
reload the page.
On Windows, $PWD works in PowerShell and Git Bash but not cmd.exe — run node cli.js --help and
copy the ready-made claude mcp add … line it prints, which carries the full path already. The
shortcuts are Alt+Shift+A and Ctrl+Enter, and the UI labels them that way. install-native-host
is macOS and Linux only; on Windows, start the bridge in a terminal.
Which browsers
Chromium — Chrome, Edge, Brave, Arc, Opera, Vivaldi. Load unpacked, as above; the test suite
drives headless Chromium, so that is the one continuously verified.
Safari — built rather than loaded: bash tools/make-safari.sh (needs Xcode).
Firefox — not yet.
What differs on Safari and what blocks Firefox
Safari does not take unpacked extensions, so tools/make-safari.sh wraps it in a small macOS app —
it converts, builds, and prints the four Safari settings to flip (the important one is
Develop ▸ Allow Unsigned Extensions, which resets every time Safari quits). One capability is
missing there: "world": "MAIN" content scripts are unsupported, so inspector.js cannot read React
fibers or Vue instances, which costs you the component chain and source-file hint. Everything else
— picking, regions, comments, pins, screenshots, the bridge, MCP — is unchanged.
Firefox is closer than it was (every script prefers browser where it exists), but two manifest
blockers remain: background: { service_worker } where Firefox MV3 wants background: { scripts },
and a missing browser_specific_settings.gecko.id. Both are fixable, but keeping them honest needs a
Firefox job in CI rather than a claim in a README. Open an issue if you want it.
Native iOS apps (Simulator)
A native app has no DOM, so this path reads the accessibility tree instead. It works for SwiftUI, UIKit, React Native and Flutter apps, and needs nothing added to your app.
You need Xcode with a booted Simulator and Maestro (it reads the tree,
and needs Java — a Homebrew openjdk is found even when it is not on your PATH). The bridge keeps one
maestro mcp process running for it, so only the first load waits (~10s, while Maestro starts its
on-device driver); every refresh after that takes about a second. Every Maestro on your Mac shares that
one driver, so if another one (an agent's Maestro MCP server, a test run) restarts it, the bridge's next
read fails, and the bridge then starts a fresh Maestro and tries once more. If the first load takes
minutes, close the Claude Code sessions you are not using that have the Maestro MCP server.
Setup asks whether your app is web or iOS, and for iOS opens this page for you. Otherwise, with the
bridge running — node cli.js from the clone, or npx -y pinpoint-bridge with no clone at all — open
http://127.0.0.1:7331/ios. It shows the Simulator's screen: hover to
see each element, click one, type what should change, ⌘↩. The note reaches your agent like any
other, with the element's accessibilityIdentifier (your testID), its label, its path in the tree,
its frame and a crop. Press R (or Refresh) after the app changes; resolved notes drop off.
What it cannot give you: a source-file hint or component chain (the tree has neither — give elements
an identifier and the agent greps for it), styles, or recheck_annotation, which waits for a browser
and times out here. Android is not wired up yet.
Where it runs
Pinpoint is a tool for the app you are building, so it only loads itself on local development pages:
localhost, 127.0.0.1, .local / .test / .localhost hosts, and file:// pages once you have
granted file access. On any other site it is simply not there — no bar, no overlay, nothing injected.
Anywhere else — a staging URL, or a LAN address like 192.168.1.5:3000 when you are testing from your
phone — the toolbar popup turns it on for that one tab.
Using it
While the bridge is running, a small bar sits in the top-right corner of every page. Click it (or press ⌥⇧A / Alt+Shift+A) to start marking. Click an element, type what should change, press ⌘↩ / Ctrl+Enter, and you are immediately ready for the next one. Esc when you are done, or click Stop on the bar. The × hides the bar for that site; the popup brings it back, and can move it to any corner.
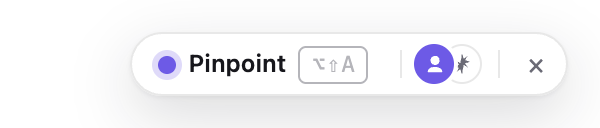 |  |  |
| It tells you the shortcut, and who is here — you, and your agent. | After a few seconds it settles to a dot, out of your way. Hover to bring it back. | Picking. The bar is click-through so it can never block the element you are aiming at; Stop is the exception. |
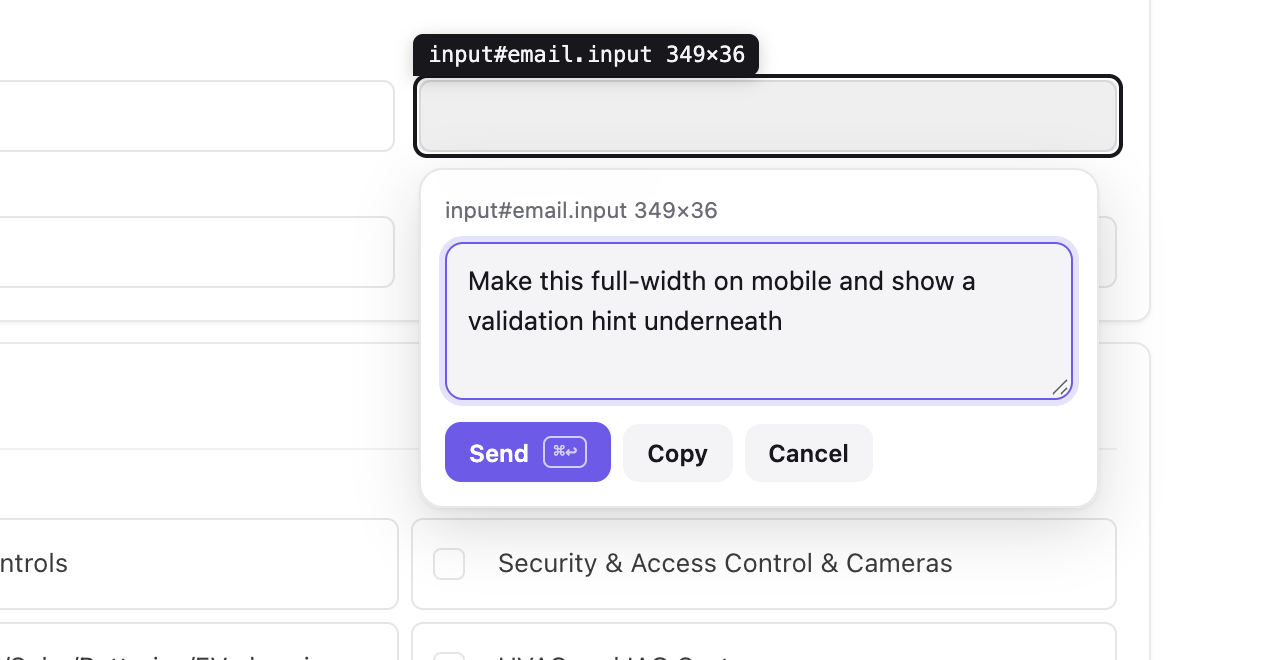
The popover names exactly what you picked, so you can tell two near-identical buttons apart before you type.
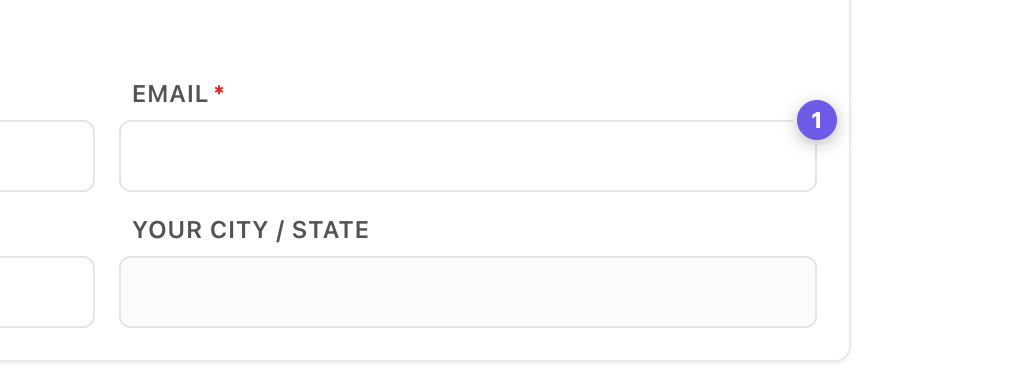
A numbered pin sticks to the element — numbered per page, so each page counts from 1. Pins live in the bridge, not the page, so they survive reloads, appear in every tab showing that page, and vanish the moment your agent marks the change done. On apps that rebuild their DOM, each pin re-finds its own element by identity, and hides itself rather than sit on a different element that happens to match the old selector. The bar's counter opens the list of everything marked on this page; click a row to jump to it.
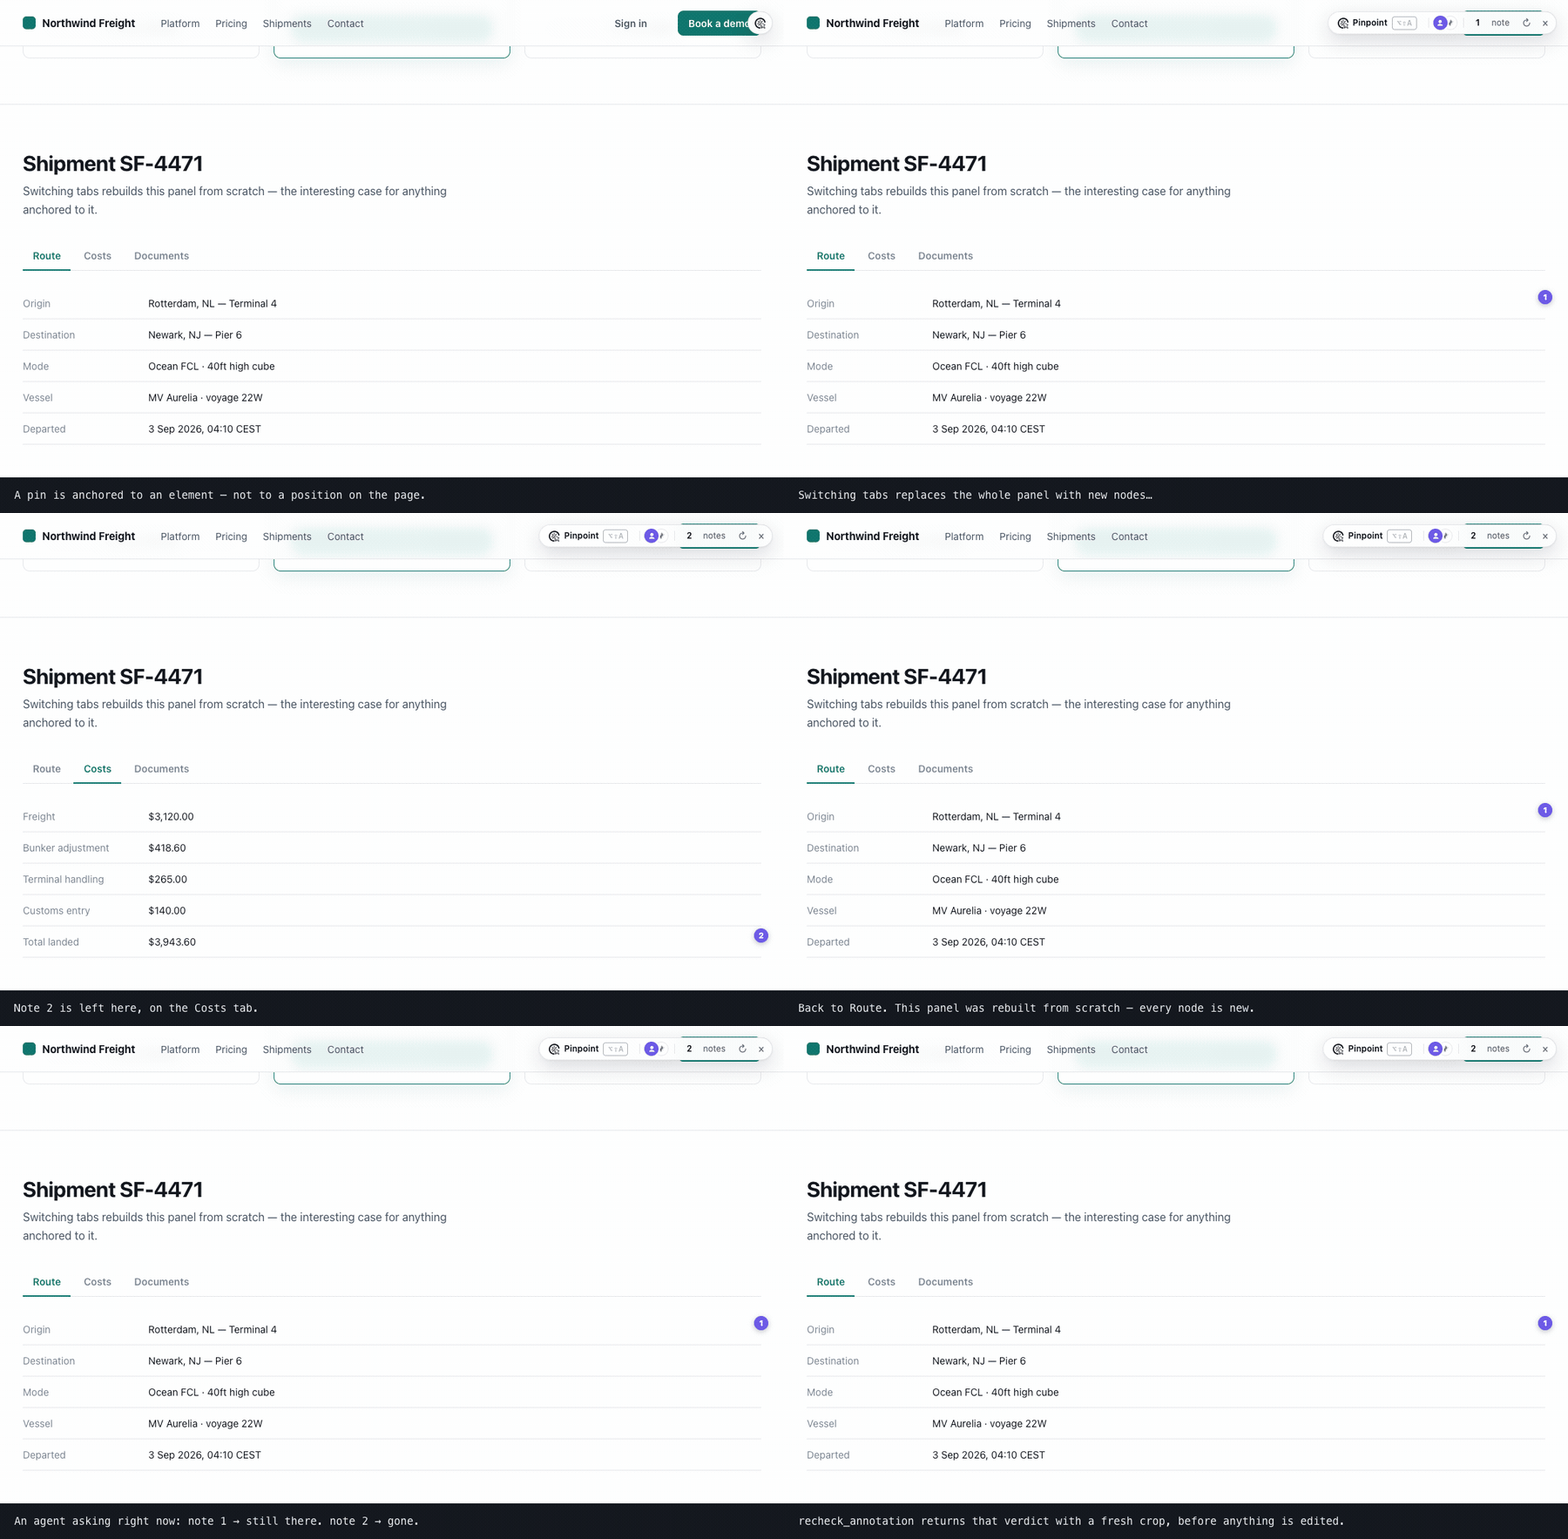
The same two notes, twice. Switch tabs and the panel is rebuilt from scratch — note 1 re-finds its own element among nodes that did not exist a moment ago, while note 2 admits it is not on this view. An agent asking at that moment is told the same thing.
When the page moves underneath a pin. A pin that can no longer find its element does not just
hide itself — the bridge is told, so the next thing your agent reads says the element may be stale
rather than handing it a selector that has gone bad. And recheck_annotation asks your browser to
look again right now: it re-finds the element, says whether it is gone, moved out from under its
selector, or merely changed, and returns a fresh crop next to the one taken when you marked it. If no
tab is open on that page it says it could not look — never that nothing changed.
Marking an area. Some changes are about a group — "make these cards two-up on mobile". Drag instead of clicking and you get a box, anchored to the deepest element that fully contains it. Your agent gets a real container to change, plus the list of what the box held and a screenshot cropped to it.
Reading the reply. A finished note does not vanish. It stays in the panel with your agent's own reply underneath, so you can read what changed without going back to the terminal.
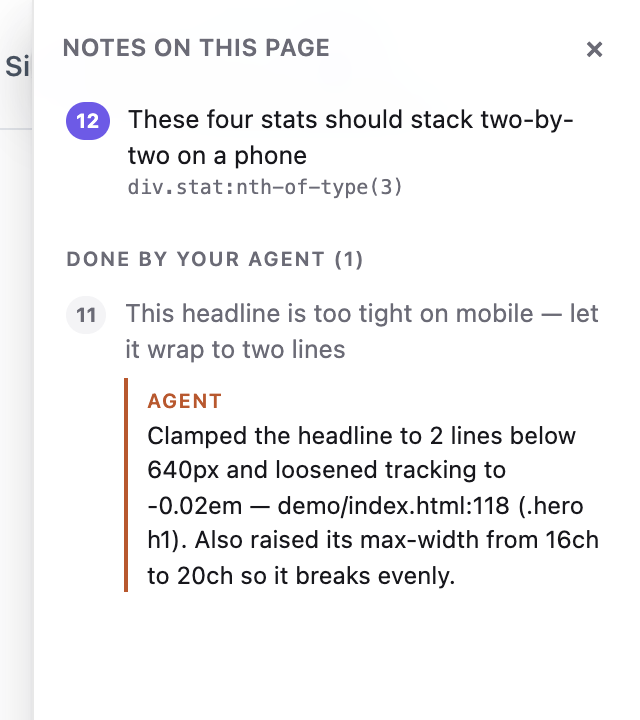
That reply is the note your agent passes to resolve_annotation, which is required — the tool
tells it that you read this in your browser, and that "done" is not an answer. While it works, the bar
says what it is doing: the note it is looking at gets a ring, and a note it completes disappears in
front of you.
Then just talk to Claude Code normally. With hooks installed you don't have to mention Pinpoint at all; without them, say "apply my pinpoint annotations". If the bridge isn't running, Send copies a ready-to-paste prompt to your clipboard instead, so nothing is lost.
Starting and restarting the bridge from the browser
A browser cannot start a process, so install-native-host registers a tiny launcher with Chrome (and
Brave, Edge, Arc, Chromium, Vivaldi, Opera). After that the popup's Start bridge button works, and
while the bridge is running that button and the ↻ in the on-page bar restart it — what you want
after pulling a new build, without leaving the page.
The launcher can do exactly one thing: run this repo's own cli.js on a port number, read from the
popup's setting and never from the page. Restart is plain HTTP to the bridge itself, so it needs no
launcher and works in Safari too. macOS and Linux only for now; on Windows, start the bridge in a terminal.
When more than one agent is connected
Agents introduce themselves in the MCP handshake, so the bar names the one that is working
(claude-code, cursor-vscode, codex) instead of saying "your agent", and each reply in the panel is
attributed to whoever wrote it. wait_for_annotation hands each new note to exactly one waiting
agent, so two agents watching at once share the queue rather than both doing the same note — and if one
resolves something another already finished, it is told so.
How your agent finds out
Three mechanisms, strongest first. They stack — using all three is fine.
- Hooks (automatic).
node cli.js install-hooks <repo>adds aSessionStartand aUserPromptSubmithook to<repo>/.claude/settings.json, both runningcli.js print --hook. It prints nothing when nothing is pending, so a normal session is unaffected. Mark something in the browser, type anything in Claude Code, and it comes along. Your own settings in that file are preserved, and re-running updates rather than duplicates. Restart Claude Code once afterwards. - MCP (on request). The
pinpointserver's instructions tell the agent to check for annotations whenever you talk about a UI or feature change, so "make that button bigger" usually triggers a lookup on its own. - A watch loop (hands-off). Say "watch pinpoint and apply each change as it comes in". The agent
parks on
wait_for_annotation, which returns the instant you hit Send — screenshot included.
Looks or behaviour
The comment is the instruction, in your words, and it can be about anything the element is part of. Both of these are good notes:
- "Make this full-width on mobile and drop the shadow" — a styling change, made where the element is.
- "Clicking this should save the draft first, and show a toast if the save fails" — a behaviour change. The button is just the way in: the agent is told to follow it from its component into the handler, the state, the API call and, if that is where the fix belongs, the backend route.
Every channel — MCP, the hooks, pending.md, the copy-to-clipboard buttons — tells the agent that a
note may be about either, so a behaviour request is not restyled and called done. The more you say
about the outcome you want ("should", "instead of", "when … then …"), the less the agent has to guess.
Connecting other agents
The simplest entry runs the published package, so there is no path to get right:
npx -y pinpoint-bridge mcp. It talks to whichever bridge is running, cloned or not. To pin the agent
to your clone instead, use the absolute path to cli.js (from pinpoint/bridge, run pwd and add
/cli.js, or copy the line node cli.js --help prints). Restart the editor afterwards; MCP servers are
read at startup.
Cursor — one click from cursor.directory, or
.cursor/mcp.json (or ~/.cursor/mcp.json for every project):
{ "mcpServers": { "pinpoint": { "command": "npx", "args": ["-y", "pinpoint-bridge", "mcp"] } } }
Codex CLI — ~/.codex/config.toml:
[mcp_servers.pinpoint]
command = "npx"
args = ["-y", "pinpoint-bridge", "mcp"]
Any MCP client over HTTP — http://127.0.0.1:7331/mcp (Streamable HTTP, stateless). Windsurf,
Cline, Continue, Zed and Gemini CLI all take a URL.
No MCP at all — run the bridge with --project <repo> and it keeps <repo>/.pinpoint/pending.md
current (with its own .gitignore). Tell any agent "read .pinpoint/pending.md and apply it"; it
finishes each one with node cli.js resolve <id>. Or use Copy prompt in the popover to paste into any chat.
Commands
Run these from pinpoint/bridge.
node cli.js [start]            start the bridge (default command)
node cli.js mcp                run as a stdio MCP server
node cli.js status             is it running? how many pending?
node cli.js print              pending annotations as markdown  (--consume also resolves them)
node cli.js resolve <id...> --note "what you changed"
                               mark done — the pin disappears and your note is shown as the reply
node cli.js install-hooks [dir]  wire up Claude Code
node cli.js install-native-host   let the popup's "Start bridge" button start the bridge
                               (--uninstall removes it; --id <id> allows a second checkout)
node cli.js clear              delete everything
node cli.js --help

http://127.0.0.1:7331/ios      the iOS Simulator picker, served by the running bridge

--port <n>       default 7331, or $PINPOINT_PORT (set the same number in the popup)
--project <dir>  mirror pending annotations into <dir>/.pinpoint/
--print          echo each new annotation to stdout as it arrives
$PINPOINT_HOME   where annotations are stored (default ~/.pinpoint)
MCP tools
| tool | purpose |
|---|---|
get_pending_annotations | everything pending as a markdown task list, each with its screenshot |
list_annotations | one line per annotation |
get_annotation | full detail + screenshot for one id or pin number |
recheck_annotation | re-find the element in the live page and report what changed, with a fresh crop next to the original |
resolve_annotation | mark done → the pin disappears in the browser within a second |
wait_for_annotation | block until the developer sends the next one |
clear_annotations | wipe everything |
Resource: pinpoint://pending (markdown).
What an annotation contains
comment          "make this full-width on mobile"          ← the only instruction
page             url, title, viewport, scroll
element          tag, id, classes, a CSS selector built from stable attributes where they exist
                 (`button[data-action="next"]` rather than `:nth-of-type(2)`; shadow DOM via
                 "host >>> inner"), DOM path, rendered text, trimmed outerHTML, role/aria/data-*
                 attributes, bounding box, ~25 computed style properties, and a fingerprint
                 (tag + text + key attributes) used to verify a pin is still on the right element
source           framework (react/vue/svelte/angular/astro), component chain,
                 file:line where the dev build exposes it
screenshot       PNG of just the element (+8px), long edge ≤1200px
From the iOS Simulator, element carries the accessibility identifier,
label, text and value instead, the path through the accessibility tree, and the frame in points;
source is ios-native with no file, and page.url is ios-simulator://<device name>.
For exact file:line on React 19 or Next, add a dev-only inspector plugin
(vite-plugin-react-inspector, @react-dev-inspector) — Pinpoint reads the data-source attributes
they emit, as well as React's own _debugSource/_debugStack and Vue's __file.
Troubleshooting
No bar appears on the page
The bar only shows while the bridge is running — that is how it tells you it is live. Check
node cli.js status from pinpoint/bridge. If the bridge is up but the bar still isn't there, the page
is probably not one Pinpoint injects into automatically (see Where it runs) — open the toolbar popup
and turn it on for that tab.
Nothing at all on a file:// page
Chrome keeps file access off per extension. On chrome://extensions → Pinpoint → Details →
"Allow access to file URLs", then reload.
The toolbar dot never turns green
Either the bridge isn't running, or it is on a different port from the extension: the popup's Port
field and the bridge's --port must match. If node cli.js status says "port answers, but it is NOT
the pinpoint bridge", something else owns that port — start the bridge with --port 7332 and set 7332
in the popup too.
port 7331 is already in use
Usually the bridge is already running from another terminal, in which case you're done. Otherwise pick a free port as above. Don't run two bridges at once: they share one store file and the last writer wins.
An annotation has no screenshot
The picture is taken just after your comment is stored, so the comment is never lost. If the page navigated or the tab was closed in that moment, the annotation records why instead of attaching a picture of the wrong page. The comment, selector and styles are all still there.
Claude Code doesn't mention my notes
Hooks are read when a session starts — restart it once after install-hooks. Check that
<your repo>/.claude/settings.json has two entries containing print --hook, and that the path in them
still exists (moving your Pinpoint clone breaks it — re-run install-hooks). You can always just say
"apply my pinpoint annotations".
"Start bridge" says one-time setup is needed, or can't find Node
Run node cli.js install-native-host once, then press it again. If you have already run it, run it again
— moving the repo, or reloading a build without the manifest key, changes the extension's id, and Chrome
reports a rejected id the same way as a missing launcher. Quit and reopen the browser afterwards. The
launcher also bakes in an absolute path to node, because a browser-started process does not get your
shell's PATH; if node moved (a new nvm version, a Homebrew upgrade), re-run it.
You want a clean slate
node cli.js clear empties the store; ~/.pinpoint/annotations.json is the only state outside your repo.
A page to try it on
demo/index.html is a self-contained demo site — no build, no network — with the shapes that make
Pinpoint worth using: a card grid and pricing tiers for region drags, near-identical sibling buttons, a
tab panel that rebuilds itself, a dense table, and a form.
cd demo && python3 -m http.server 8080 # then open http://localhost:8080
Testing
cd test && npm install && npx playwright install chromium && npm test
102 tests. bridge.test.mjs covers the daemon, CLI, hooks, the iOS picker's tree-to-annotation path
and every MCP tool over both stdio and Streamable HTTP; e2e.test.mjs loads the unpacked extension into headless Chromium and drives real pages
— React, Vue, shadow DOM, an iframe, a strict-CSP page, a 3,600-node stress page, DPR 2, cross-tab sync,
and a form that rebuilds its whole DOM. See CONTRIBUTING.md for what each suite is for.
Safety and storage
The bridge binds to 127.0.0.1, refuses any request carrying a web page's Origin (the one exception
is its own, for the /ios page it serves, which also refuses to be framed), and identifies
itself with a service marker; everything scraped from the page is labelled untrusted where it reaches
your agent, and only your typed comment is presented as an instruction. Screenshots live base64-encoded
inside ~/.pinpoint/annotations.json rather than as loose files. SECURITY.md has the full
trust-boundary notes, including why the <all_urls> permission is needed, and PRIVACY.md
says exactly what is collected, where it is stored, and the one place it leaves — the coding agent you
connect it to.
Roadmap
- Android emulator:
maestro hierarchyalready reads the tree there; it needsadbfor the screenshot. - Native source hints: React Native's
_debugSourceand Flutter's widget creation locations, via an optional dev-only package in the app. - CSS source mapping via
chrome.debugger(which rule set this colour, and where). - Page-level annotations — a note about the whole page rather than an element or an area.
- Firefox: the manifest needs a
scriptsbackground and agecko.id. - Agent replies on the pin itself, not only in the notes panel.
Contributing
Issues and pull requests are welcome — see CONTRIBUTING.md. There is no build step:
clone it, npm install in bridge/, load extension/ unpacked, and you are developing. Every behaviour
change should come with a test.
Licence
MIT — see LICENSE. Release notes live in CHANGELOG.md.