GRIDCITY
Local MCP server for your whole fleet of Linux servers, databases, Redis and S3 buckets, shown as a 3D city. Tools for root-cause incident reports, security findings, connection diagnosis with proven fixes, topology and blast radius; run_command only runs after you approve it. MIT, local-first.
Documentation
GRIDCITY
Your servers, databases and buckets as a living 3D city of light: monitor, manage, secure and fix them in one local app, with an MCP server for your AI agent.






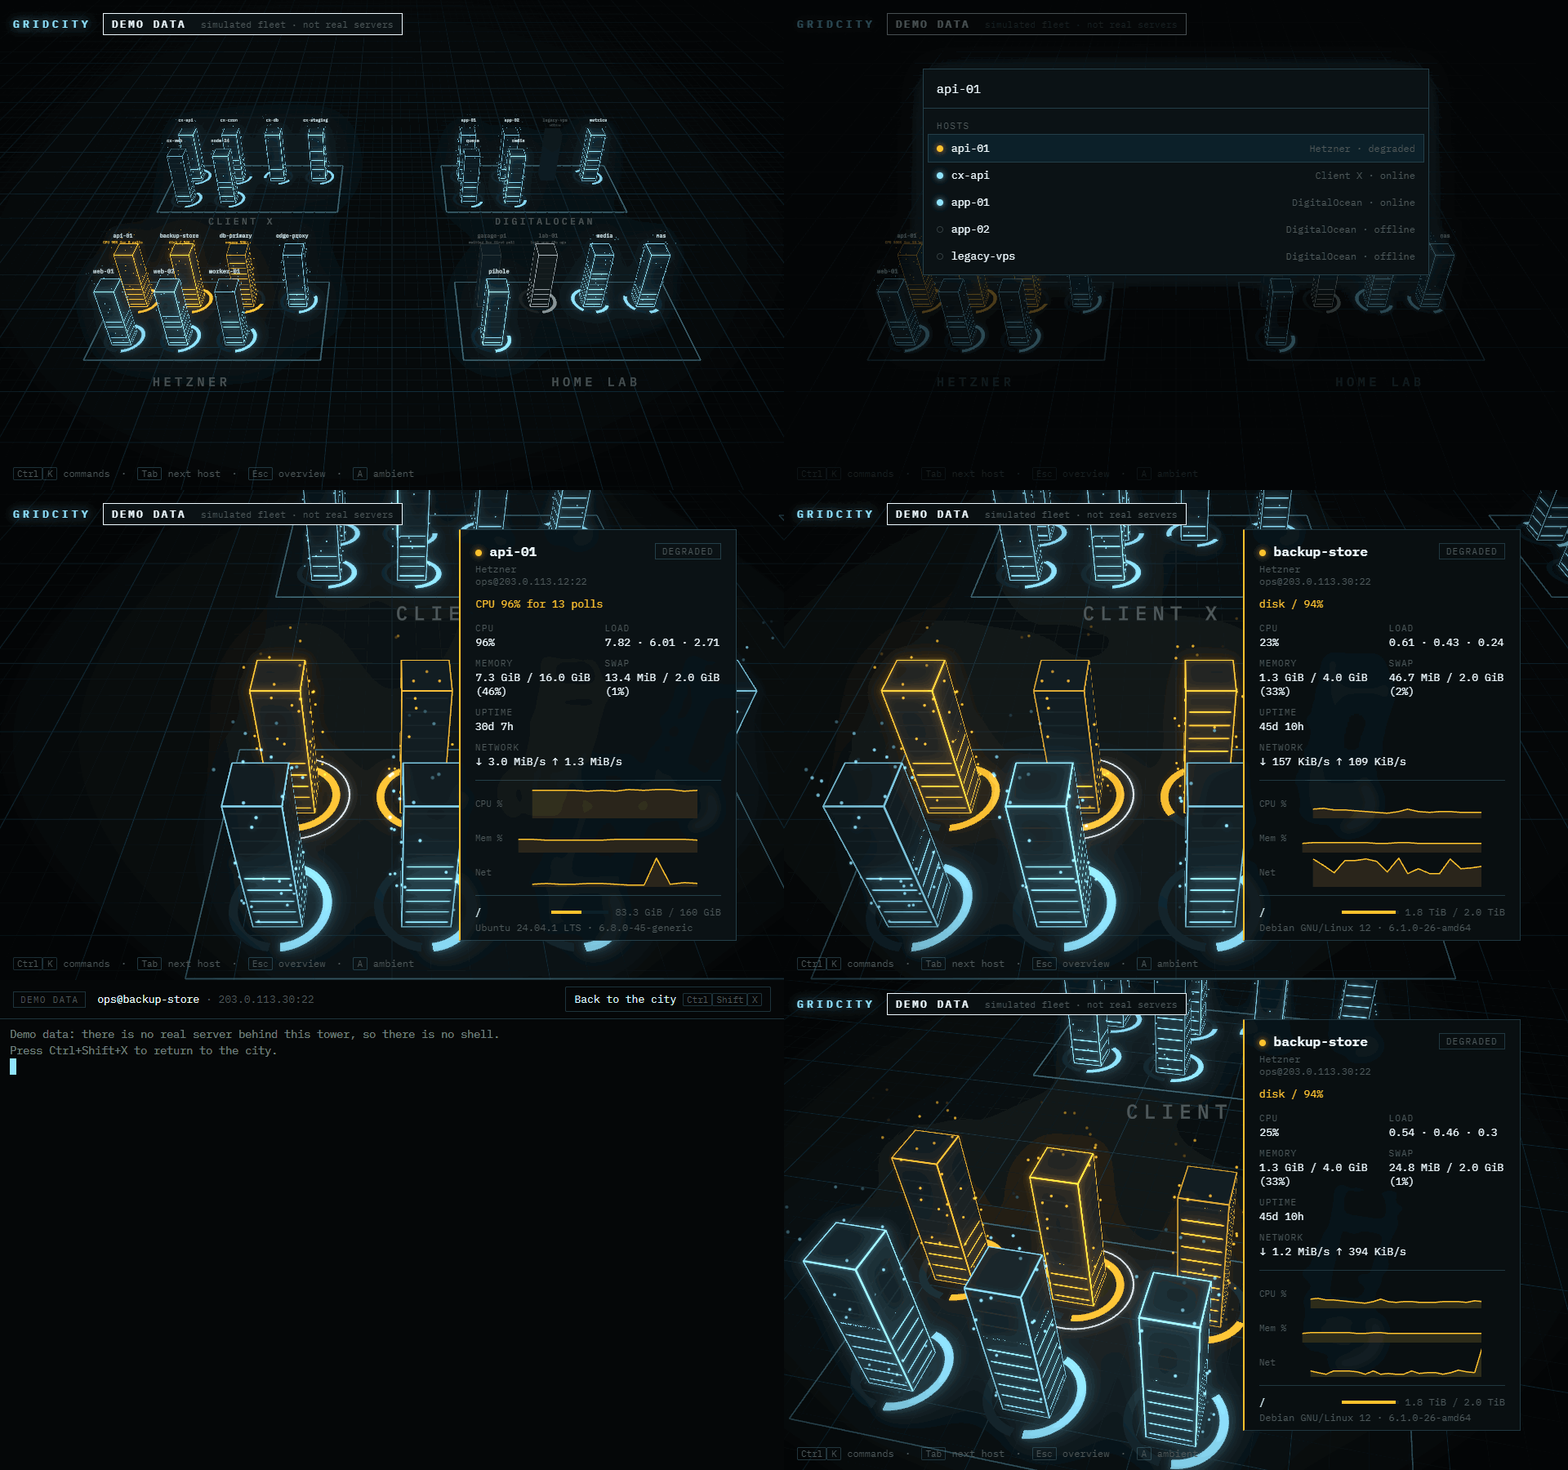
Live demo · Documentation · Quick start · MCP tools · The Doctor · Changelog
GRIDCITY is a local-first infrastructure monitor, admin console and MCP server for SSH servers, databases, Redis, MongoDB, buckets, load balancers and HTTP/TCP endpoints. Every one of them becomes a building whose light tells the truth about it. Dive into any server for a real terminal, browse and edit a database or bucket, see who is attacking what with a red ring on the building, get alerts on your phone while the app is closed, rewind the whole city to last night's outage, and let Claude Code, Cursor or any MCP client ask "what is the root cause?" in one call, with every command your AI wants to run waiting for your click. Nothing leaves your machine: no cloud, no account, no telemetry.
Quick start
Try it without installing anything: the live demo runs a simulated city of eight districts in your browser. Try the Doctor (press D on a red building: the connection checks, the cause and a proven fix), Security (S: attacks and exposures, with red rings on the buildings), Upcoming (U: certificates, disks and backups that are due), time travel (T) and Ctrl+K. Everything there is simulated DEMO DATA. The terminal, managing databases, alerts and AI agents need the app itself:
npx gridcity demo            # a simulated city, no setup at all
npx gridcity                 # your own servers (connect them in the app), runs in the background
npx gridcity stop            # stop it (gridcity status shows the link again)
npx gridcity mcp             # connect Claude Code, Cursor or any MCP app
or with Docker, no Node needed:
docker run -d --name gridcity -p 127.0.0.1:4600:4600 \
  -v gridcity-config:/config -v gridcity-data:/data ghcr.io/chapeee/gridcity
docker logs gridcity          # the link with your session token
Contents
- MCP server for AI agents
- What makes it different
- Install
- Use it with your servers
- Databases, RDS and object storage
- Manage databases, Redis and buckets
- Alerts that reach you with the app closed
- Security: who is attacking what
- Upcoming: expiry dates, full disks, late backups
- Investigate and fix
- Districts, probes, load balancers and services
- Codex and Gemini inside the app (ACP)
- Reading the city · Controls
- Security: SSH · Security: databases and cloud
- Development · Environment variables
MCP server for AI agents
GRIDCITY is an MCP server (Streamable HTTP) for your whole fleet. Your AI agent gets the same picture you see in the city: what is broken, why, what else goes down with it, and a proven fix. It can run commands on your servers only after you approve each one on a card in the city.
1. Start GRIDCITY (it must be running while the AI uses it):
npx gridcity # or: npx gridcity demo, to try the tools on a simulated fleet
2. Connect your AI app. gridcity mcp prints the exact command and JSON with your token
filled in (also in the app: Ctrl+K → Ask an AI agent… → Copy command).
Claude Code
claude mcp add --transport http gridcity http://127.0.0.1:4600/mcp \
  --header "Authorization: Bearer <token>" --header "X-Agent-Client: Claude Code"
Cursor, Windsurf, VS Code, Claude Desktop and other MCP apps
gridcity mcp --json prints this config. Put it in your app's MCP config (Cursor:
~/.cursor/mcp.json; VS Code: .vscode/mcp.json, under "servers"):
{
  "mcpServers": {
    "gridcity": {
      "type": "http",
      "url": "http://127.0.0.1:4600/mcp",
      "headers": {
        "Authorization": "Bearer <token>",
        "X-Agent-Client": "Cursor"
      }
    }
  }
}
Apps that only speak stdio can reach it through a bridge such as
npx mcp-remote http://127.0.0.1:4600/mcp --header "Authorization: Bearer <token>".
3. Ask in plain words:
- "Why is the site down?"
- "Which server is running out of disk, and what is filling it?"
- "What breaks if orders-db goes offline?"
- "The new database won't connect. Diagnose it and tell me the fix."
- "Is anyone attacking my servers right now? Which ones are blocked?"
- "Update the packages on the staging servers."
Tools
| Tool | What the AI gets | Read-only |
|---|---|---|
incident_report | everything not healthy, grouped by likely root cause, with what each explains and puts at risk | yes |
security_findings | attacks and exposures (brute force, logins after guessing, public buckets, open databases…) and the checks that could not run | yes |
diagnose | the Doctor for one target: DNS → port → TLS → login, with fixes proven by a real connection | yes |
get_topology | districts and links (declared, observed, load balancer targets), and a target's blast radius | yes |
list_servers | servers: status, OS, CPU, memory, disks, uptime, listening ports, containers, failed units | yes |
list_resources | databases, buckets, probes and load balancers with their metrics | yes |
list_runbooks | saved diagnostic and maintenance commands and where they apply | yes |
run_command | runs a shell command on one server after you approve it | no |
wait_for_command | collects the result of a command that was still waiting for your approval | yes |
You stay in charge
- Every command is an approval card in the city, on top of everything (even an open terminal): the exact command, the server, the client and the AI's reason. Allow, Allow all on this server (until restart; destructive commands still ask) or Deny with a note for the AI.
- Secrets never reach the AI. When a command needs a
sudopassword or a token on stdin, the card asks you; it goes to the command only, never to the AI or the log. - Everything is audited: every command that runs, and every one you deny, with who asked and who allowed.
- Local only. The endpoint listens on
127.0.0.1and requires the session token.
Full reference: MCP tools · AI agents guide.
What makes it different
- The Doctor proves fixes before it suggests them. "Could not connect" becomes "stops at
LOGIN: the server requires TLS". The Doctor climbs DNS → port → TLS → login, matches the real
error against 30 rules, recognises managed providers, then tries each candidate fix with a real
read-only connection. You get "Turn on TLS: proven, connected with this change" and one click to
apply it. Also headless:
gridcity doctor --jsonin CI, or as a tool for your AI agent. - Time travel. Press T and drag: every tower shows its load, memory, disks and traffic as they were at that moment, every building its status. Press Play to watch last night's incident unfold, or jump between incidents on the timeline.
- Root cause and blast radius. The city knows who talks to whom (what you declare, connections it sees on your servers, load balancer targets). When ten things go red, a banner names the one that explains the others; every panel shows what goes down with it.
- Built for AI agents. Connect Claude Code (
gridcity mcpprints the command). Your agent getsincident_report,security_findings,diagnose,get_topology,list_runbooksandrun_command, and every command waits for your click in the city. - Manage, not just monitor. Press M on a database, Redis or bucket: tables and queries for PostgreSQL, MySQL, SQL Server and SQLite in one SQL manager, keys and a console for Redis, documents for MongoDB, files and policies for buckets. Read-only until you allow changes; every change is audited.
- Security on the map. Brute force, a login right after failed guesses, a second root account, a new open port, a public bucket, a database open to the internet: a red ring strikes the building, the Security panel says who, from where, whether it is blocked and what to do, and one click blocks the attacker. CrowdSec and Fail2ban findings show up too.
- It warns you before things break. Certificates and domains that expire, disks that will be full in days, backups that are late, vulnerable packages with fixes waiting, containers in a crash loop, cloud cost spikes.
- Alerts with the app closed. Browser push (Windows, macOS, Android), email, Slack, Discord, Telegram, Teams, ntfy, Pushover, Gotify and Apprise, sent by the server.
- Districts that hold anything. A district is a VPC, an account, a rack: EC2 next to its RDS, bucket and ALB, a home lab next to its probes.
- Everything in the app. Connect servers (paste or upload a key, trust the fingerprint),
databases, buckets, probes and load balancers in forms; passwords and keys are stored encrypted
on your machine. No
.envediting.
Principles
- Truth first. Every light maps to exactly one metric. An offline server is dark and still; data that stopped arriving freezes and greys out with a "last seen" label. Replay is labelled REPLAY. Nothing is ever faked. See docs/VISUAL_LANGUAGE.md.
- Local first. Runs on your machine, listens on
127.0.0.1only, connects outward to your servers. No cloud, no account, no telemetry, no CDNs. - Your secrets stay yours. SSH uses your ssh-agent or a key file path; private keys and passphrases are never stored. Database passwords, access keys and the alert webhook you paste in the app are saved encrypted on your machine only (never in a config file, never in logs). Unknown or changed host keys are refused, never auto-accepted.
- The world is a map, never a gate. Everything you can do with the mouse works from the keyboard (Ctrl/Cmd+K).
Install
| How | Command | Needs |
|---|---|---|
| Try it | npx gridcity demo | Node.js 22.12+ |
| Install the command | npm i -g gridcity, then gridcity | Node.js 22.12+ |
| Docker | the docker run above, or compose.image.yaml | Docker |
| From source | git clone, npm install, npm run dev | Node.js 22.12+ |
gridcity                      start with your servers in the background, then open the printed link
gridcity demo                 start with a simulated city (also in the background)
gridcity status               is it running? prints the link again
gridcity stop                 stop the background server
gridcity restart              stop, then start with the same mode and port
gridcity logs [-f]            show the background server's log (-f: follow)
gridcity doctor [--json]      check this machine and every server, database, bucket and probe
gridcity mcp                  connect Claude Code or any MCP app
gridcity add-host user@host   test and add one SSH server
gridcity import-ssh-config    add every host from ~/.ssh/config
  --port <n>  --open  --new-token  --foreground
The link printed at start contains a session token; it stays the same across restarts (bookmark
it). The server keeps running in the background after you close the terminal; --foreground
keeps it attached instead. Remote servers must be Linux.
Try it from source
npm install
npm run demo
The demo is a simulated fleet (always labelled DEMO DATA). It behaves like a real one: load
rises and falls through the day, and every so often a server runs a busy job, gets a traffic surge,
leaks memory until its service restarts, or reboots. To watch it at four times the speed, open the
in-browser demo with ?source=demo&poll=500.
The live demo on GitHub Pages is the same web app built
with STATIC_DEMO=true: no server, always the in-browser demo, 96 hosts by default (?hosts=
changes it). The Docs workflow builds it into website/build/demo/. To build it yourself:
STATIC_DEMO=true npm run build:demo -w @app/web (output in apps/web/dist-demo/).
Use it with your servers
npm install
npm run dev
Your hosts live in hosts.yaml, created with a commented example on first start:
| Platform | Location |
|---|---|
| Linux/macOS | ~/.config/<project>/hosts.yaml |
| Windows | %APPDATA%\<project>\hosts.yaml |
| Docker | ./config/hosts.yaml |
(<project> is PROJECT_NAME in lowercase.) Edit it any time: the running app reloads it live.
hosts:
  - id: web-01
    name: web-01
    address: 203.0.113.10
    user: ops
    district: Hetzner # one district per value
Or import every concrete host from ~/.ssh/config, either from the empty-city screen and the
command palette, or from a terminal (safe to run again):
npm run import-ssh-config
Easiest: Connect a server. Press Ctrl+K and choose Connect a server… (or the button in the empty city). Pick where the server is and type its address, then:
| Where | What you need | User name |
|---|---|---|
| AWS (EC2, Lightsail), Oracle Cloud | the key file (.pem/.ppk) | found for you (ubuntu, ec2-user, opc…) |
| Google Cloud | your key, pasted in the console | the one you type (you@address) |
| Azure, DigitalOcean, Hetzner, any VPS | the key you chose, or the password | azureuser / root by default |
| Your own server | the password once | yours (you@address) |
| Private server behind a bastion | the key, plus the jump host address | per server ("Reach it through a jump host…") |
The steps:
- Trust: the app shows the server's fingerprint. Compare it and confirm; it is added to
your
known_hosts, like answering "yes" inssh. - Key: pick a key from your ssh-agent or
~/.ssh, upload a key file you were given (an AWS/cloud.pem, a PuTTY.ppk, or an OpenSSHid_*), or let the app create one. Uploaded keys are copied into your SSH folder;.ppkfiles are converted to OpenSSH format. Cloud servers usually already accept their key, so there is no password step. Copy public key gives you the line to paste into a provider's console (Google Cloud gets itsuser:keyform). - Install: if the server doesn't accept the key yet, enter the password once. The app
adds your public key to the server's
authorized_keys; the password is never saved. - Done: the server is saved to
hosts.yamland lights up.
Doing it by hand instead: each host must be in ~/.ssh/known_hosts (connect once with ssh
and verify the fingerprint), and your key must be in a running ssh-agent (ssh-add), or set
auth: { method: keyFile, path: ~/.ssh/id_ed25519 } for an unencrypted key. On Windows the
built-in OpenSSH agent works. npm run add-host -- user@address tests and saves one host.
For production use: npm run build && npm start (single port, serves the built app).
Docker with real servers: plain docker compose up --build is enough. Keys and trusted
fingerprints made in the app are kept in the data volume (/data/ssh), so restarts and rebuilds
never lose them (docker compose down -v deletes them). To use your own ~/.ssh and ssh-agent
instead, copy compose.ssh.example.yaml to compose.ssh.yaml, keep your platform's block, then:
docker compose -f compose.yaml -f compose.ssh.yaml up --build
Databases, RDS and object storage
In the app (no config files needed): Ctrl+K → Connect a database, bucket, probe or
balancer…. Pick the kind, fill a short form, paste the password or access keys, press Test
connection (one real read-only poll shows what it can see, or why it can't), then Add to the
city. Credentials are saved encrypted on this machine (see below); resources.yaml only gets a
reference such as passwordSecret: orders-db.password. A focused resource has Edit (name,
district, tags, a new password or keys) and Remove (which also deletes its saved credentials).
Prefer environment variables or files? They are under Advanced in the same form.
Or by hand: add them to resources.yaml, next to hosts.yaml (created with a commented example on first
start, reloaded live). Each kind is watched by one connector built on the standard open-source
library for it, and gets its own building in the city:
| Kind | Library | Building |
|---|---|---|
| PostgreSQL | pg | drum (3 stacked discs) |
| MySQL / MariaDB | mysql2 | drum |
| MongoDB | mongodb (official) | drum |
| SQL Server | mssql | drum |
| SQLite (a file on this machine) | better-sqlite3 | drum |
| Redis / Valkey | ioredis | hexagonal prism |
| AWS RDS (every instance in a region) | @aws-sdk/client-rds + @aws-sdk/client-cloudwatch | drum in a thin cage |
| S3, DigitalOcean Spaces, MinIO, R2 | @aws-sdk/client-s3 with a custom endpoint | warehouse, one per bucket |
resources:
  - kind: postgres
    id: orders-db
    host: db.internal
    user: monitor # GRANT pg_monitor TO monitor;
    passwordSecret: orders-db.password # pasted in the app, stored encrypted, never here
  - kind: postgres
    id: reports-db
    host: db.internal
    user: monitor
    passwordEnv: REPORTS_DB_PASSWORD # or: read it from an environment variable
  - kind: redis
    id: cache
    host: 10.0.0.7
    passwordFile: ~/.secrets/redis # first line of the file
  - kind: rds
    id: aws-prod
    region: eu-west-1 # your normal AWS credentials or `profile:`
  - kind: s3
    id: media
    provider: spaces
    endpoint: https://blr1.digitaloceanspaces.com
    accessKeyIdEnv: SPACES_KEY
    secretAccessKeyEnv: SPACES_SECRET
What you see: up/down, connections against the maximum, queries per second, slow queries, replica lag, cache hit ratio and size for databases; CPU, free storage, connections, IOPS and replica lag from CloudWatch for RDS; object count, size, growth per hour and reachability for buckets. Anything an engine (or your user's grants) does not expose shows as a dash, never as zero. Click a building or find it in Ctrl+K for its panel. The demo has DEMO DATA equivalents of every kind.
Test the connectors against real instances in Docker: npm run test:connectors.
Districts, probes, load balancers and what runs on your servers
A district holds anything, the way a VPC or a provider account does: EC2 servers next to
their RDS instances, the S3 bucket and the load balancer in front. Hosts and resources name their
district with the plain district: label; districts.yaml (next to hosts.yaml, optional)
adds the provider, region and a line of description. Click a district name on the floor, or pick
it in Ctrl+K, for its panel: how many buildings are online, degraded, offline or stale, what lives
inside, and which links cross its border. R opens the runbooks for every server in it.
districts:
  - name: AWS Mumbai
    provider: aws # aws | gcp | azure | digitalocean | hetzner | oracle | cloudflare | home | onprem…
    region: ap-south-1
    description: Production VPC: EC2 behind the ALB, RDS and the media bucket.
Probes and load balancers join the city through resources.yaml or Ctrl+K → Connect a
database, bucket, probe or balancer…:
| Kind | What it watches | Building |
|---|---|---|
http | An endpoint checked from this machine: status, round trip, redirects, TLS certificate expiry and issuer | beacon (thin spire) |
tcp | A port: open or not, connect time, optional TLS certificate and banner | beacon |
loadbalancer | AWS ALB/NLB: state, healthy targets, requests/s, target response time, 5xx (CloudWatch), target addresses | gate (low wide slab, 6 bands) |
A slow endpoint pulses fast (round trip over 1.5 s turns it amber), a certificate expiring within 14 days turns the beacon amber, an unexpected status or a refused connection turns it dark. A gate lights one band per healthy share of its targets; one unhealthy target makes it amber.
Service discovery. Every 30 s (configurable, discoveryIntervalMs) each connected server
answers one more read-only script: listening ports with the process when visible (ss), Docker
containers and their state (docker ps, when this user may), failed systemd units, whether a
reboot is required, pending updates on Ubuntu, and the TCP connections it has open. The host
panel shows all of it under Services; a restarting container, a failed unit or pending
security updates are called out.
Topology. The floor shows who talks to whom as flowing light between buildings, from the user
to the used. Three honest sources, nothing guessed: dependsOn: [ids] on a host or resource
(declared), connections really seen on a server that match another building's address and port
(observed; they fade when no longer seen), and the targets a load balancer reports (balances).
Both panels list links under Talks to; the district panel lists the ones crossing its border.
Runbooks (R, or Ctrl+K → "Run a runbook"). Commands you type a hundred times, saved once in
runbooks.yaml and run on one server or many: pick servers by district or tag, see exactly what
will run, confirm, and read one row per server with the exit code and output. A handful of
read-only diagnostics ship built in (top processes, what fills the disk, listening ports, failed
services, containers, recent errors, pending updates, who is connected, TLS certificates on the
server); an entry with the same id replaces one. "A command, this once" runs anything you type.
Every run lands in the audit log (command, servers, exit codes).
runbooks:
  - id: restart-nginx
    name: Restart nginx
    command: sudo -n systemctl reload nginx || sudo -n systemctl restart nginx
    match: { tags: [web] } # optional; every server when omitted
Manage databases, Redis and buckets
Focus a database, Redis or bucket and press M (or Ctrl+K → Manage …).
| Kind | What you can do |
|---|---|
| PostgreSQL, MySQL/MariaDB, SQL Server, SQLite (one SQL manager) | browse schemas and tables, page, sort and search rows, edit cells, insert and delete rows, structure, foreign keys both ways, DDL, a query editor with completion, Explain and history |
| Redis / Valkey | browse keys with an editor per type, TTL and rename, a console that asks before dangerous commands, timed MONITOR, slow log, clients, INFO |
| MongoDB | find with Extended JSON filters, edit, insert and delete documents (types round-trip), aggregation, indexes, running operations |
| S3, Spaces, MinIO, R2 | browse, upload with drag and drop, download, delete, copy, move, tags, previews, bucket policy, CORS, versioning, usage per folder |
Every view opens read-only, and read-only is enforced by the database itself (read-only or rolled-back transactions, read-only SQLite files, Redis's own write flags). Allow changes… turns writing on for that resource; every change is written to the audit log. Manage guide.
Alerts that reach you with the app closed
Alerts are sent by the server the moment something goes offline, degraded or recovers, and when an attack or an expiry needs you, whether or not anyone has GRIDCITY open. Settings → Alerts:
- Browser notifications (Web Push): turn them on once per browser; Windows, macOS and Android notifications arrive with the tab closed.
- Channels: email over any SMTP server, Slack, Discord, Mattermost, Google Chat, Telegram, Microsoft Teams, ntfy, Pushover, Gotify, and Apprise for 100+ more. Test before saving; choose offline, degraded, recovered and attacks per channel.
A "back online" or "attack over" message always follows an alert that went out, even after a restart, and a flapping target alerts at most once per ten minutes. Everything is saved encrypted. Alerts guide.
Security: who is attacking what
Read-only checks over the SSH connection GRIDCITY already has (nothing installed): SSH brute force, a login right after failed attempts, logins from new addresses, new accounts, a second root account, new open ports, refused sudo, and vulnerable packages (checked against OSV.dev). Where installed, CrowdSec and Fail2ban findings are shown too, and the same attacker seen by several tools is one finding. Resources are checked for public buckets, databases open to the internet, and Redis or MongoDB without a password.
High and critical findings put a pulsing red ring on the building and send alerts; the Security panel (S) gives the attacker's address, how often, whether it is blocked, and what to do. GRIDCITY catches known patterns, not every attack, and says which checks could not run. Security guide.
Try it on purpose: node scripts/security-lab.mjs up starts a lab server with CrowdSec and
Fail2ban and two attackers on a private Docker network; attack runs real brute force, password
guessing and backdoor accounts against it.
Upcoming: expiry dates, full disks, late backups
The Upcoming panel (U) lists everything dated, soonest first, with alerts 30, 7 and 1 days ahead: TLS certificates (read with their own handshake, so an expired one is still seen), domain registrations (RDAP), disks that will fill up (trend since the last cleanup), and backup checks (a file pattern on a server or a prefix in a bucket that must be fresh and big enough). Upcoming guide.
Investigate and fix
- One-click fixes from a finding: block an attacker (Fail2ban, CrowdSec or the firewall), lock
an account, block public access on a bucket. Each shows the exact command, needs a second click,
runs through
sudo -n(never a password) and is audited. - Runbooks for a finding: the right read-only diagnostics, one click away.
- What happened: the incident timeline around any moment (status, attacks, commands people and AI ran, changes, alerts), from a finding or from time travel.
- Log search (L): one search across every server's journal,
/var/logand container logs. - Containers and Kubernetes: crash loops, OOM kills, unhealthy containers and pods in trouble become findings; the HUD shows CPU, memory and restarts per container.
- Cloud costs (C): month to date, forecast, top services and spikes per AWS account (off until you turn it on: Cost Explorer charges per request).
Codex and Gemini inside the app (ACP)
Prefer an agent inside the app? In Ctrl+K → Ask an AI agent…, pick an agent and press Start. The app runs the vendor's open-source adapter through the Agent Client Protocol (the standard the Zed editor uses), and you sign in with your own account:
| Agent | Signs in with |
|---|---|
| Codex (OpenAI) | your ChatGPT subscription (a browser window opens), or OPENAI_API_KEY |
| Gemini CLI (Google) | your Google account, or GEMINI_API_KEY |
| Claude (API) | ANTHROPIC_API_KEY only; for a Claude subscription, use Claude Code above |
Type, or press Speak and say it (the browser's speech recognition). The agent reaches your
servers only through the app's two tools, so its commands get the same approval cards. It
gets no files or shell on your computer, and any local action it asks for is refused. The first
start downloads the adapter with npx (pinned versions). In Docker the agent can't open a
browser to sign in: put an API key in .env (see .env.example).
Why no Claude login in the panel? Anthropic doesn't allow third-party apps to use Claude subscription logins, so the app never asks for one. With MCP, Claude Code stays your own app.
Reading the city
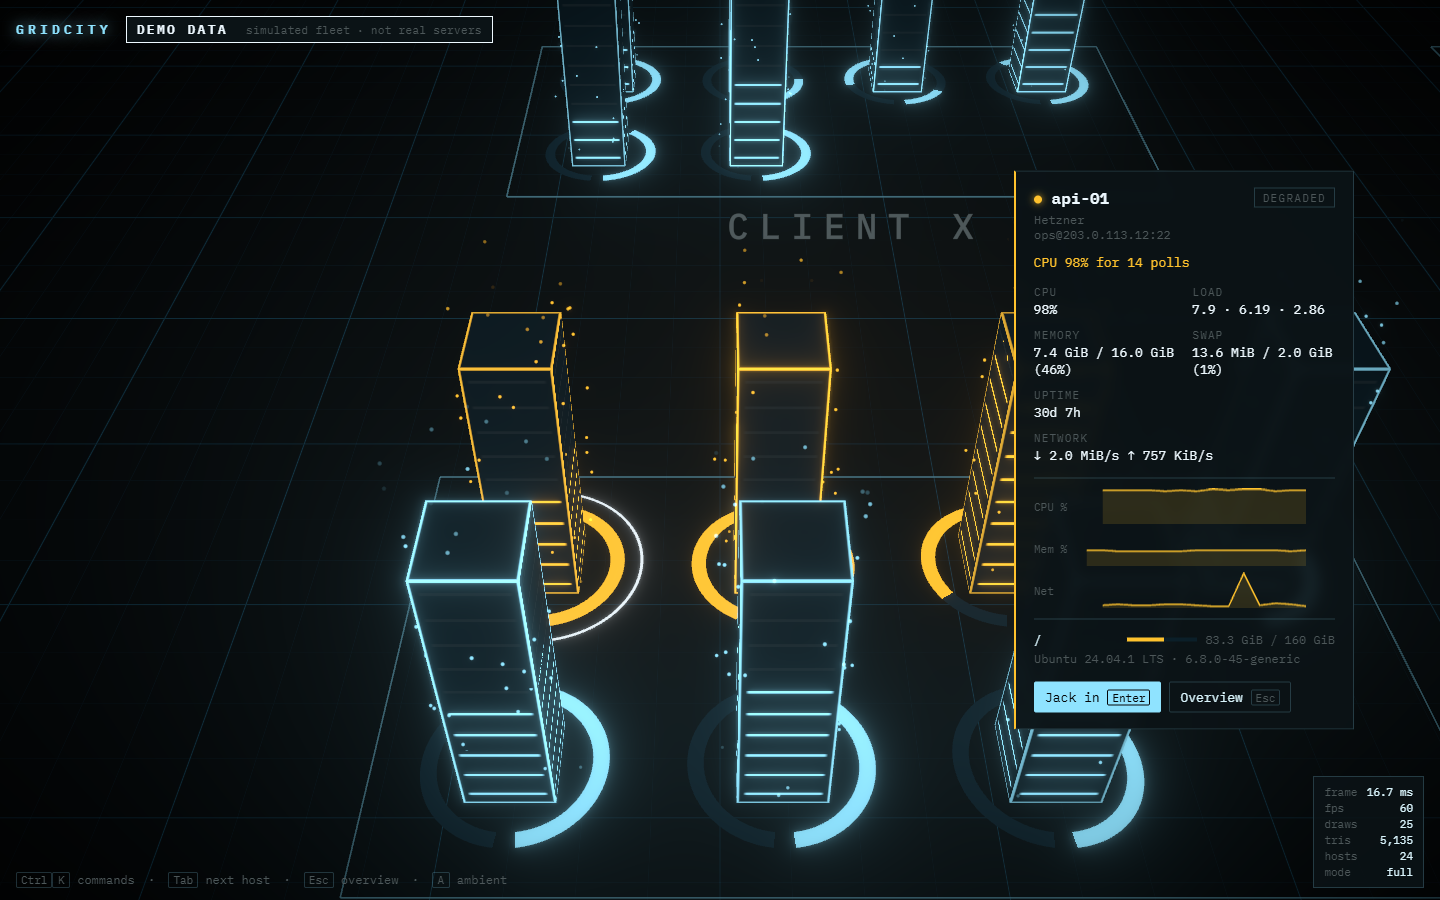
| You see | It means |
|---|---|
| Cyan edges · amber edges | online · over a threshold (CPU, memory or a disk) |
| Edge pulse speed | CPU usage |
| Horizontal light strips, filling upward | memory usage |
| Segmented ring at the base | each disk's usage; amber arc = that disk is nearly full |
| Particles rising around a tower | network throughput (log scale) |
| Dark, motionless tower | offline; the HUD says why |
| Grey, dim, frozen tower, "last seen …" | stale: data stopped arriving |
| Faint outline only | not measured yet |
| Drum · hexagonal prism · caged drum | a database · Redis · an RDS instance |
| Drum discs / prism strips lit upward | connections used of the maximum |
| Pulse speed on a drum or prism | queries (or commands) per second, log scale |
| Low warehouse, roof cells lit | a bucket; lit cells = stored size (log scale) |
| Particles over a warehouse | the bucket is growing (log scale) |
Every encoding, and the reasoning behind it: docs/VISUAL_LANGUAGE.md.
| Focus a host | Jack in | A refused host key |
|---|---|---|
 |  |  |
History, Edit and Settings
- History (H, or "Fleet history" in Ctrl+K): when was a server overloaded or down? Every status change is recorded, so you see each incident (degraded or offline, its reason, when and for how long), a timeline over the range, and CPU, memory, disk and network charts with the server's warning threshold drawn in. Gaps mean no data, never zero. Kept for 7 days by default.
- Edit (E, or the HUD button): rename a server, move it to another district, set tags, give
it its own warning thresholds (for example warn at 75 % CPU on a small box), or remove it.
hosts.yamlis updated in place with your comments kept; the id never changes, so the server keeps its place in the city and its history. - Settings (Ctrl+K): how many days of history to keep (1–90), and the warning thresholds for every server (CPU and for how many polls, memory, disk, poll interval, when data counts as stale).
Controls
| Key | Action |
|---|---|
| Click a tower | Fly there and open its HUD |
| Drag | Move across the city at the same zoom (right-drag or two fingers orbit, wheel zooms) |
| Arrow keys | Pan the city |
| Ctrl/Cmd+K | Command palette: search hosts, every action |
| Tab / Shift+Tab | Jump to the next / previous host |
| Enter | Jack in: a real terminal on the focused host |
| Ctrl+Shift+X | Leave the terminal (Esc and Ctrl+K belong to the shell in there) |
| Esc | Close panels, stop ambient mode, back to the overview |
| A | Ambient mode: tour hosts that need attention (for a second monitor) |
| H | History of the focused server (or every incident in the fleet) |
| E | Edit the focused server: name, district, tags, its own warnings |
| D | The Doctor: diagnose the focused building, or check everything |
| T | Time travel: rewind the city and play it back |
| R | Runbooks: run saved or typed commands on one server or many |
| M | Manage the focused database, Redis or bucket |
| S | Security: attacks and exposures |
| U | Upcoming: expiring certificates and domains, full disks, backups |
| L | Search the logs of every server |
| C | Cloud costs |
| ` (backtick) | Performance overlay |
Also in the palette: lite mode (no bloom or particles, for weak GPUs, suggested automatically when
frames are slow), the audit log, importing from ~/.ssh/config, and replaying the intro.
What this does with your SSH access
- It opens one SSH connection from your machine to each host in
hosts.yaml, using your ssh-agent or the key file you configured. Keys are read at connect time and never copied, logged or stored. Passphrases are never asked for. - It verifies every host key against your
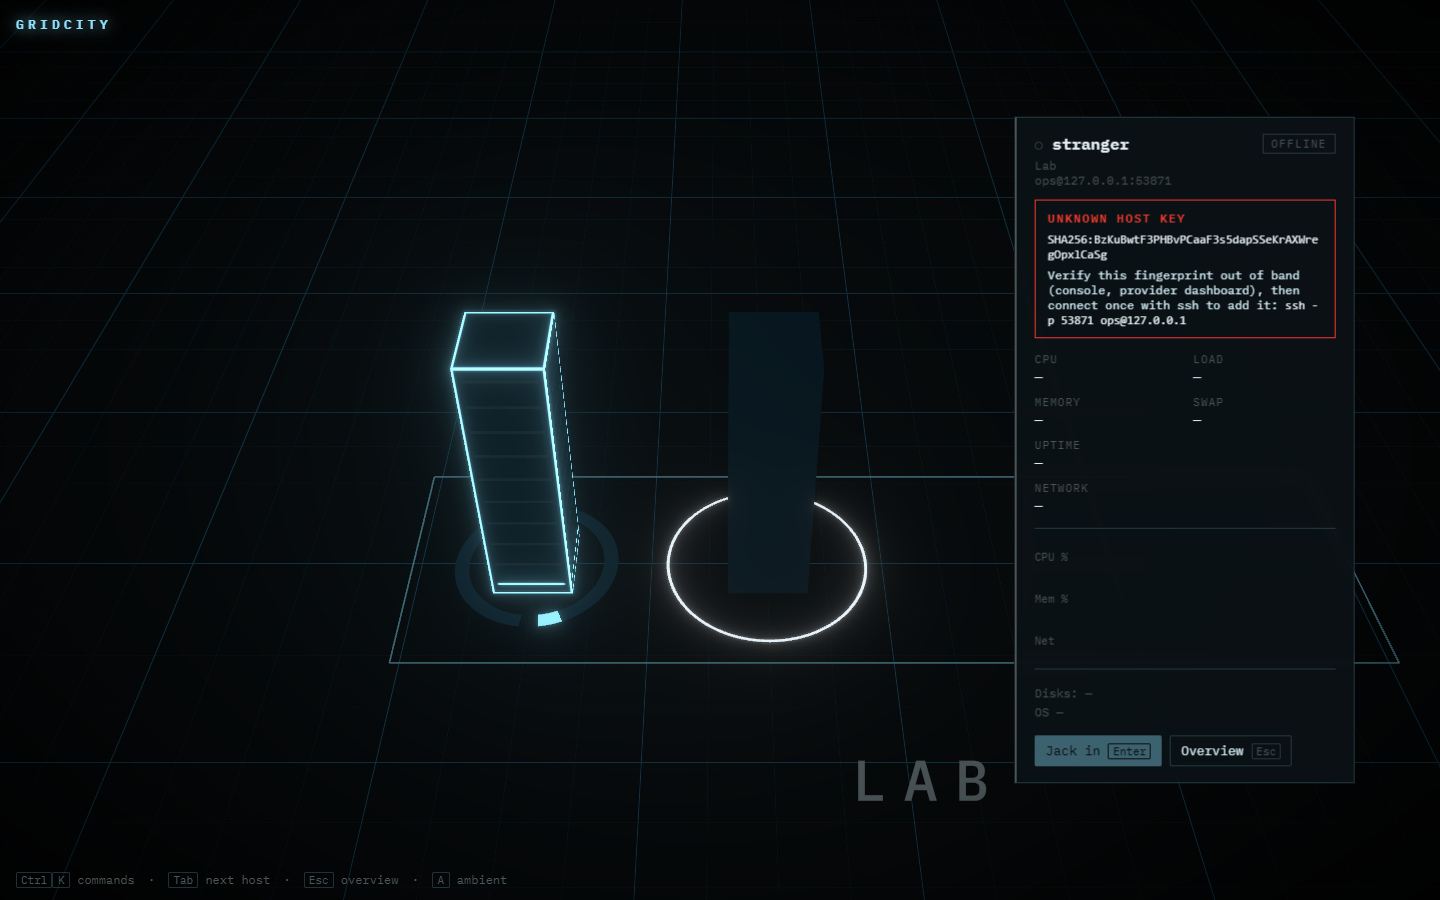
known_hosts. Unknown, changed or revoked keys are refused and shown with their fingerprint; nothing runs on that host. - It writes to your SSH setup only inside Connect a server, after you act: it appends a host
key you confirmed to
known_hosts(never replacing a changed one), may create a new key file (never overwriting one), and uses a password once, in memory, to add your public key to the server'sauthorized_keys. - Every 2 seconds it runs one fixed, read-only script per host that reads
/proc,dfand/etc/os-release. Every minute a read-only security sweep reads the auth log, accounts, listening ports and, where allowed withsudo -n, CrowdSec and Fail2ban; every few minutes Docker and the installed packages. It installs nothing and changes nothing on your servers. - It changes a server only when you click a fix (block an address, lock an account) after seeing the exact command, or run a runbook or a terminal command yourself.
- When you jack in, it opens an interactive shell on the existing connection. What you type runs
with that user's permissions, exactly like
ssh. - It keeps an append-only audit log of connections, host key refusals and terminal sessions (opened/closed, with duration). It does not record what you type: capturing commands from a terminal is not reliable, and we don't pretend otherwise.
- An AI agent (Claude Code over MCP, or Codex/Gemini in the panel) runs a command only after you approve that exact command (or chose "allow all on this server" for this run of the app). Those commands are recorded in the audit log, with who asked and who allowed.
- The browser UI is reachable only from this machine, only with the session token printed at startup, and only from its own page (Host and Origin checks block other websites).
Details and limits: docs/THREAT_MODEL.md.
What this does with your database and cloud access
- Each connector only reads statistics:
pg_stat_*views (in a read-only session),SHOW STATUS, MongoDB'sserverStatus, RedisINFO, SQL Server DMVs (ApplicationIntent=ReadOnly), SQLite opened read-only,DescribeDBInstancesandGetMetricData, and for bucketsListBuckets,HeadBucketandListObjectsV2. It never reads your rows or objects, and never writes. Use a read-only monitoring user anyway;resources.yamlshows the grants for each. - Credentials you paste are stored encrypted, on this machine only. AES-256-GCM in the local
database; the key is a random 32-byte
vault.keyin the data folder (in Docker: the/datavolume), or your ownSECRETS_KEY.resources.yamlholds only references, and still refuses apassword:key or a password inside a URL. Values are never logged, audited, sent back to the browser or shown to an AI. Honest limit: anyone who can read your data folder as you can read the key too, like a browser's saved passwords. Back upvault.keywith the data folder; without it, saved credentials must be typed again. - You can still use references instead:
passwordEnv/passwordFile,accessKeyIdEnv/secretAccessKeyEnv, or an AWSprofile(or the standard AWS chain when no keys are given). Error messages are scrubbed of secrets before they are logged or shown. - Manage views write only after you turn on "Allow changes" for that resource; every change is audited (what and where, never values).
- Exposure checks are read-only: bucket policy and public access settings, RDS and security
groups, and one unauthenticated
PING/ database list to see whether Redis or MongoDB need a password. - To find vulnerable packages, package names and versions (no host names or addresses) are sent to api.osv.dev every 12 hours. Domain dates come from the registries' public RDAP service.
- Reachability changes are written to the audit log (reachable / unreachable, never every retry).
Development
Docker is the reference environment for development and testing, so everyone gets the same results.
| Task | Docker | Native |
|---|---|---|
| Dev servers with hot reload | npm run docker:dev | npm run dev |
| All checks (format, lint, types, test) | npm run docker:test | npm run check |
| Start the built server and verify it | (part of docker:test) | npm run smoke |
| Browser tests + review screenshots | npm run docker:e2e | npm run test:e2e |
| Re-record the README GIF | npm run media |
Dev mode serves the web app on http://127.0.0.1:4601 and proxies /api and /ws to the
server on port 4600. ?source=demo runs the demo fleet entirely in the browser (no server);
?hosts=50, ?seed=3 and ?poll=500 tune it.
Docker renders with software WebGL, so for real frame times run the browser tests natively on
your GPU: WORLD_GPU=1 npm run test:e2e (first run: npx playwright install chromium).
More: docs/ARCHITECTURE.md and CONTRIBUTING.md.
Environment variables
Defaults live in .env.example (committed). Put local overrides in .env (git-ignored). Real
environment variables win over both.
| Variable | Description | Default |
|---|---|---|
PROJECT_NAME | Name of the project (single source of truth) | see .env.example |
DATA_MODE | real (hosts.yaml over SSH) or demo (simulated fleet) | real |
SERVER_PORT | API and production port | 4600 |
WEB_PORT | Vite dev server port | 4601 |
LOG_LEVEL | fatal … trace | info |
CONFIG_DIR, DATA_DIR | Where hosts.yaml and the database live | OS conventions |
SSH_DIR | Keys and known_hosts the app manages (~/.ssh/<name>) | ~/.ssh |
KNOWN_HOSTS_FILE | known_hosts file the app trusts and writes to | SSH_DIR's |
Renaming the project
The project name is kept in one place, PROJECT_NAME. To rename the project:
- Change
PROJECT_NAMEin.envand.env.example. - Change the title (first line) of this README.
- Re-record the README media, which shows the name on screen:
npm run media.
Code and config read PROJECT_NAME and never hardcode the name. Package names are generic
(@app/web, @app/server, @app/shared).
Project structure
.
├── apps/
│   ├── server/          # Fastify server: SSH, metrics, state hub, terminals (loopback only)
│   └── web/             # Vite + React + three.js client; design tokens in src/design/tokens.ts
├── packages/
│   └── shared/          # Zod schemas, protocols, status rules, demo fleet
├── e2e/                 # Playwright: demo world + full stack against in-process SSH servers
├── docs/                # Brief, architecture, visual language, threat model, media
├── scripts/             # Smoke test, README media recorder
├── Dockerfile           # dev / build / runtime stages
├── compose.yaml         # Run the app (users)
├── compose.dev.yaml     # Develop and test (contributors)
└── compose.ssh.example.yaml  # Opt-in SSH access for the container